A Transformed Earth
|
|
A Transformed Earth
|
| 11/15/10 |
Transformation
Indications of transformation of the earth’s ecosystems by human activities by early in the 21st century include
Despite globally high levels of resource use by human societies altogether, some societies consume vastly more resources than others. more than one fourth of the human population lives in poverty, and about 1 billion people are underfed.
The fossil record provides a useful perspective about “normal” extinction rates over earth history. Most of the time, the normal or “background” extinction rate has been about one species per thousand species present per thousand years. In other words, extinction is normally rare. In contrast, extinction rates today are 100 to 1000 times greater than the background extinction rates of the fossil record. This figure from the Millenium Ecosystem Assessment compares extinction rates in the fossil record, in the recent past, and estimates for the future (next hundred years).
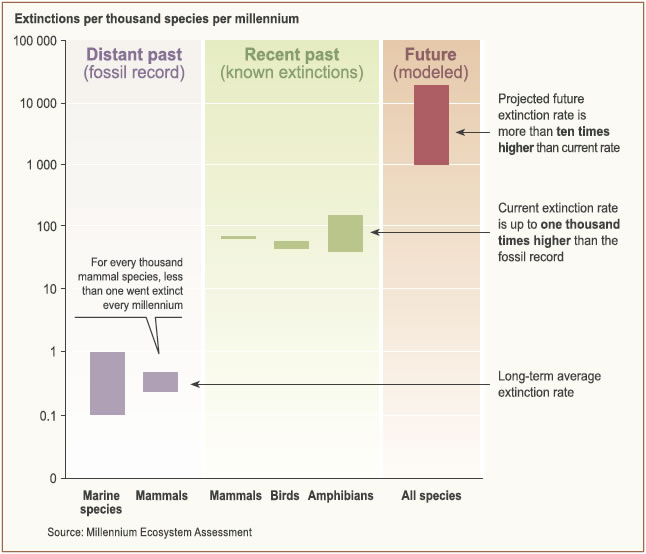
http://www.maweb.org/en/article.aspx?id=58
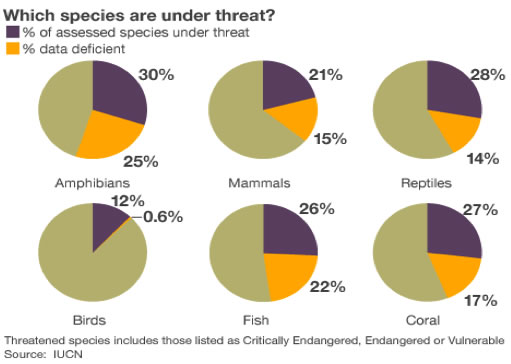
The International Union for the Conservation of Nature (IUCN) [www.iucn.org] keeps track of which species are extinct, endangered, or threatened for ecosystems around the world. Their most recent assessment (2010) is figured below for six categories of animals. The percentage of species under threat ranges from 12 to 30%.
Threats to biodiversity come mainly from six kinds of activities:
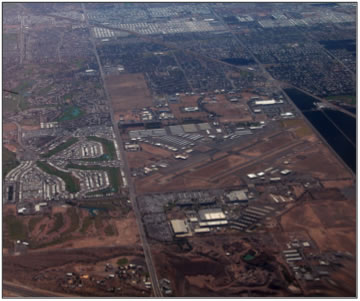
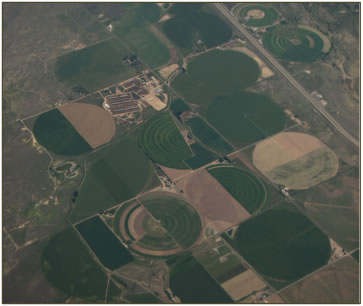
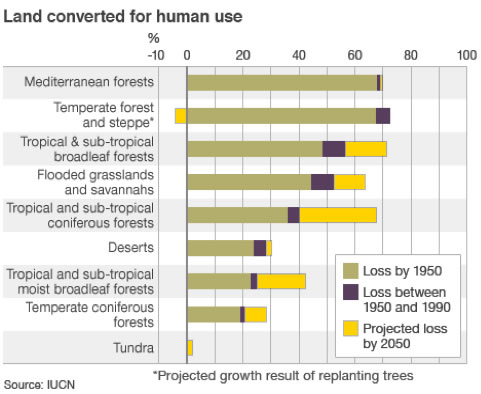
In terrestrial ecosystems, one way to assess the extent of habitat transformation is to measure the amount of different biomes that have been converted from their original condition to human uses, such as through deforestation, plowing, or urbanization. The figure below (also from the IUCN) illustrates these estimates for the major terrestrial biomes. (Note that the negative conversion for temperate forest and steppe represents reforestation, indicating that biome restoration is underway in some regions.)
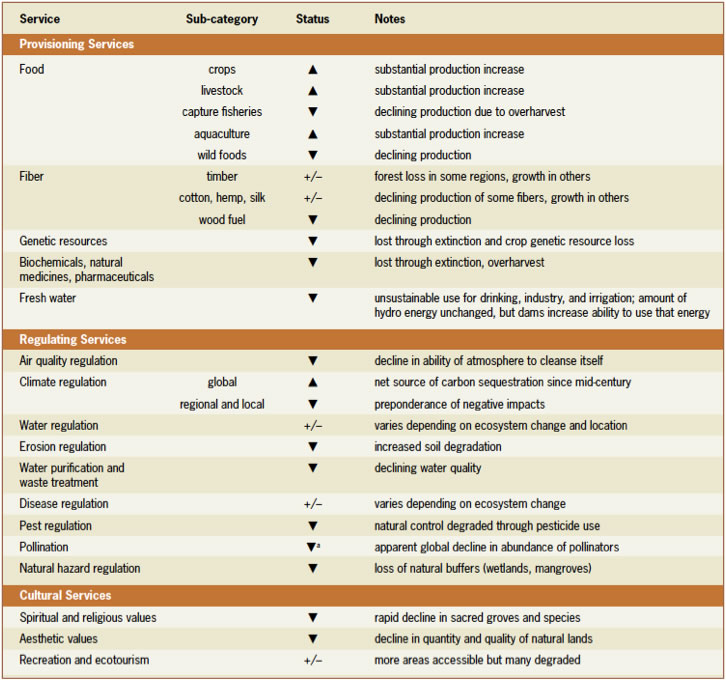
These transformation are accompanied by changes in the ecosystem services that are provided, since rates and magnitudes of ecosystem processes change when ecosystems are degraded. The Millenium Ecosystem Assessment estimated that 60% of ecosystem service are being degraded by the current intensity of human activities (see table below from the Millenium Ecosystem Assessment Synthesis report).
The concept of the ecological footprint (EF), originally developed by William Rees and Mathis Wackernagel at the University of British Columbia, is an index that measures human impact on the earth through resource use and waste assimilation. The EF is expressed in terms of land area needed to generate a particular resource or absorb a particular waste. The EF calculations for human society as a whole suggest that the current human footprint exceeds the carrying capacity of the earth; the only way that this can work is if current consumption is undermining future carrying capacity. For example, in 2007, the average global EF was 2.7 hectares (about 7 acres) per person; the global biocapacity was estimated at 1.8 hectares (about 4.5 acres) per person. So there is a deficit. Citizens of different countries have vastly different ecological footprints, as illustrated in the map below (Wikimedia Commmons).
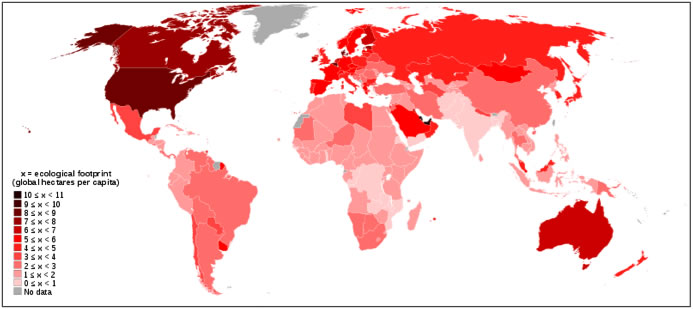
World map of average ecological footprint by country, data for 2007 from the Global Footprint Network (www.footprintnetwork.org)
Are we stuck with this deplorable situation? Not at all. There are numerous examples around the world demonstrating that a change to sustainable practices leads to a restoration of ecosystem services. Let’s consider marine ecosystems, which show many indications of excessive exploitation of fish and mollusk populations, coral reefs, and ocean-bottoms. More than half of the commercially significant marine species around the world have experienced collapse in populations from overharvesting. Nonetheless, in the small marine reserves, where fishing is not permitted at all, the response of species inside the reserve compared to outside the reserve can be substantial after just a few years. The figure below, from a global assessment by Worm et al. (2006), is based on 44 marine reserves and four large-scale fisheries closures. These protected areas showed an average 23% increase in species diversity (A, including fished and non-fished species), resulting in an increase in catch per unit effort (CPUE, panel B) outside the reserves. Resistance to disturbance of the protected areas increased resulting in greater stability and lower variability of species composition (panel C). Ecotourism increased within the reserves after they were established. This study shows that, at this point, it is still possible to recover biodiversity and ecosystem services if critical areas receive the appropriate protection and management.
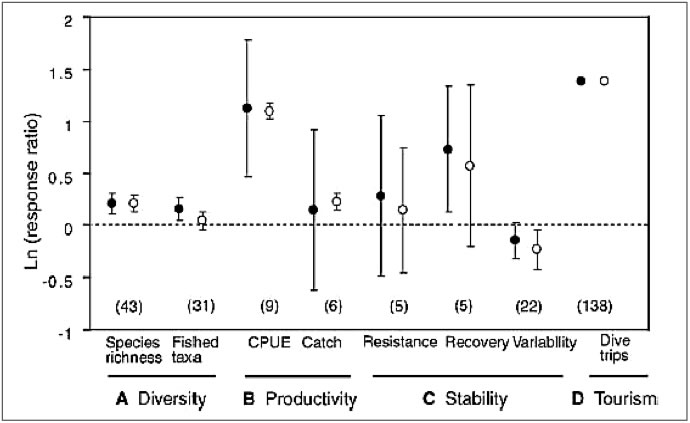
Response ratios (comparing data for inside v. outside reserve, or after v. before protection) on a logarithmic scale. Solid versus open circles represent different statistical averaging methods. From Worm et al. (2006).
Referrences and Recommended Reading
Living Planet Report 2018 ( https://www.footprintnetwork.org/living-planet-report/) for summary of global ecological footprint analyses.
Millenium Ecosystem Assessment, 2005. Ecosystems and Human Well-being: Synthesis. Island Press, Washington, DC. This report by a global team of scholars summarizes the human impacts on a wide range of ecosystem properties and services.
Worm, B. et al. 2006. Impacts of biodiversity loss on ocean ecosystem services. Science vol. 314: 787-790.
All materials © the Regents of the University of Michigan unless noted otherwise.