Evolving Earth: Plate Tectonics
We discuss:
10/09/2006 Introduction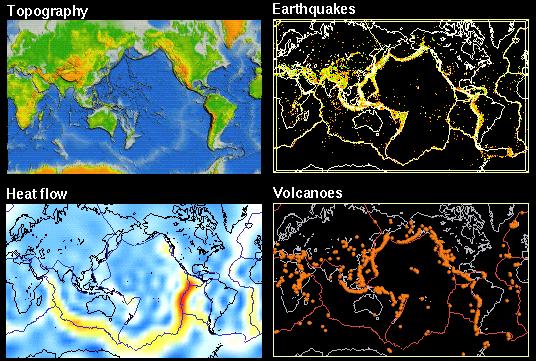
These four views show several characteristics of Earth.
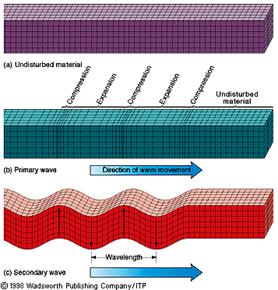
Lithosphere-AsthenosphereAt the source of an earthquake, several types of energy waves are generated. Surface waves are responsible for the damage that is associated with earthquakes, but they have limited lateral extent. In contrast, body waves can be recorded all around the world. There are two types of body waves that we will consider: compression waves and shear waves. Compression waves travel through material by pushing atoms together for a brief moment, after which they return to their original spacing. The brevity of the process implies that the material is not permanently changed, which is what we call elasticity. Pulling and elastic bend is a perfect analogy of this process, except that the elasticity of rocks is much less. Shear waves behave differently, as
the relative motion of atoms from a passing shear wave is like rubbing
your hands. Once the wave passes, the atoms return to their original state,
so in spite of the different motion, shear waves are also elastic waves.
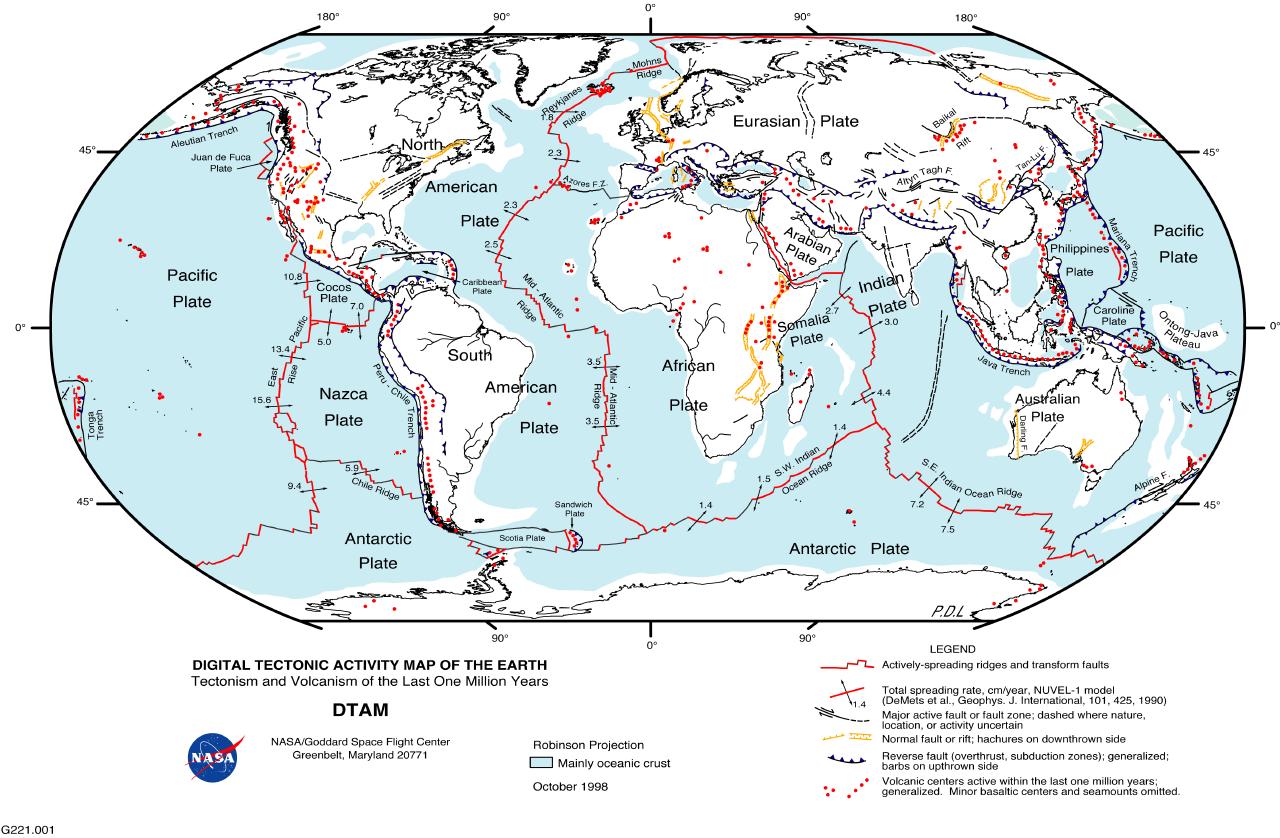
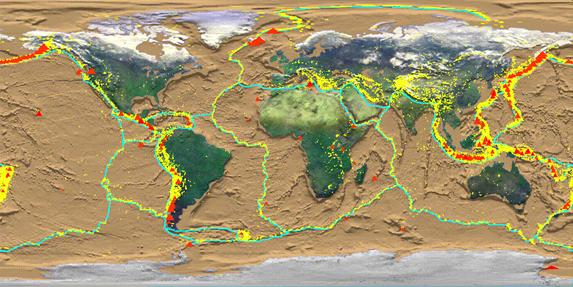
A change occurs at ~2900 km depth, where we find that compression waves decrease in velocity and that shear waves have a velocity of zero. This major change in the Earth, the Gutenberg discontinuity separates the Earth's core from the Earth's mantle. We see another jump in properties at ~5150 km depth, which means that the core is also layered. When we compare the properties of elastic waves through a material made primarily of Fe (like iron meteorites), it turns out that its characteristics match those of the core quite well. The variation in velocity of shear and compressive waves is fully explained by a liquid outer core and a solid inner core made up mostly of Fe, some Ni, and some heavily debated lighter elements such as H, O and S. Thermal BoundariesModern studies of seismic wave propagation through the mantle have shown small variations in lateral velocities that are related to variations in temperature of otherwise identical chemical materials. Areas characterized by relatively slow wave velocities represent hotter material, whereas regions with faster velocities are relatively cool. Doing such mantle tomography for the entire Earth produces a 3D scan of structures in the mantle.Most compounds move toward the solid state when pressure increases, whereas they move toward the liquid state when temperature increases. Since both temperature and pressure increase with depth in the Earth, there is an interplay between these two effects. As temperature increases with depth, the corresponding pressure increase is not everywhere sufficient to keep all mantle material in a solid state. Locally, some melting may occur, which will have an immediate effect on elastic wave properties. This reduction in velocity from traveling through less dense material occurs in what is called the Earth's Low-Velocity Zone (LVZ). In contrast to the Moho, this boundary is thermal in origin, rather than chemical. Below this region, pressure increase pushes the material back into the solid state, which is seen by an increase in velocity. This relatively cool area above the low-velocity zone is a mechanically strong layer, called the lithosphere (meaning strong as a rock). The area below the LVZ is mechanically weaker, and is called the asthenosphere (meaning no strength). Chemical BoundariesThe velocity structure in the outermost part of the Earth represents a combination of chemical and temperature variations. Above we already explored temperature variations. Recall that the relationship between density and chemistry is essentially one of number of nuclear particles per volume, so denser material in the Earth must represent different chemistry. A major chemical boundary was recognized in the mid-20th Century by Mohorovicic, as determined by a sudden increase in wave velocity. This boundary, called simply the Moho, separates a thin outermost layer of Earth that we call the crust, from the underlying layer, the mantle. The nature of this boundary is chemical in origin, like the Gutenberg boundary that separates the mantle from the core.Origin of Earth's Outer LayeringThe origin of Earth's initial differentiation between core and mantle (chemical boundary) resides in the accretionary processes of planet formation. The core formed very early in the planet's history (<50 my. after initial accretion), but the principles are covered in another section. The origin of the lithosphere has already been explained as a consequence of temperature variation of the Earth. Thus, we now concern ourselves primarily with the origin of the crust -- particularly the contrast between granitic and gabbroic (or basaltic) crust.Earth's crust is the thin shell that lies atop the thick mantle, and it is reasonable to assume that the crust is extracted from the mantle, especially the outermost part of the mantle. An interesting approach to understanding this process is to look at some tracer element. We'll use the element K (Potassium) for this purpose, which is concentrated in the outermost layers. The K content of ocean crust is ~0.1%, whereas the K content of continental crust is ~1%. As there is 10x more K in continental crust, we would need 10 units of oceanic material to make one unit of continental material. Using the average dimension of ocean and continental crust we derived earlier (70% ocean, with average thickness of 8 km; 30% continent with average thickness of 40 km), we find that the ratio of continental crust/oceanic crust is slightly greater then 2. Thus, since we have twice as much continental crust, we need 20 times today's oceanic crust to create continents. Where would all this come from? Today's ocean floor is less than 200 Ma old, with an average age of >100 million years, whereas the continents are as old as 4 Ga. So, 20 cycles of oceanic crust would take <2 by. of Earth's 4.56 Ga history. Ocean FloorThe ocean floor is not a smooth surface, but is host to large topographic variation, from mountains that rise above sea level (e.g., Hawaii) to trenches that extend 11 km below sea level (e.g., Marianas trench). The ocean basins also host the world's largest mountain belt, which is most below sea level. These ocean ridges are a system of narrow submarine mountains and canyons that are present in all of the major oceans. Along these ridges, the ocean floor is being continuously pulled apart. Hot magma rises to the surface and continuously forms new oceanic crust. The heat associated with this process is nicely illustrated by the heat flow map in figure 1. Ocean ridges themselves are offsets along (transform) faults, which are the main sites of ocean floor earthquakes.Earth's surface
consists of a mosaic of plates that continually jostle
one another. The rate at which they move ranges from 1-15 cm/year, which
means 10-150 km/my. If the Earth is not to inflate like a balloon by the
creating new material at the ocean ridges, then material must be consumed
elsewhere at the same rate. The balance occurs where plates move under
(subduction zones) and against (collision zones) one another. Thus there
are three types of plate boundaries:
divergent, convergent and transform
boundaries (see figure).
 Plate Boundaries If we plot the locations of all earthquakes in a ten-year interval (or longer), most are confined to narrow belts that define the boundaries of plates. The type of fault motion associated with these earthquakes defines the type of plate boundary. The interiors of plates are largely free of earthquakes, but there are notable exceptions to this. There are four types of seismic zones. The first follows the line of midocean ridges. Activity is low, and earthquakes occur at very shallow depths. The lithosphere is very thin and weak at these boundaries, so elastic strain cannot build up enough to cause large earthquakes. Associated with this type of seismicity is the volcanic activity along the axis of the ridges (for example, Iceland, Azores, Tristan da Cunha). The second type of earthquake is the shallow-focus event unaccompanied by volcanic activity. The San Andreas fault is a good example of this, as is the Anatolian fault in Northern Turkey. In these faults, two mature plates are scraping against one another. The frictional resistance between the plates builds relatively large elastic strains before they are periodically relieved by major earthquakes. Activity does not always occur along the entire length of the fault during any one earthquake. For instance, the 1906 San Francisco event was caused by breakage only along the northern end of the San Andreas fault, and more recent activity along the San Andreas Fault is also in restricted areas. You can imaging that this restricted movement may play a role in further likelihood of earthquakes elsewhere along the zone, which is the basis for one type of prediction. The third type of earthquake is related to the collision of oceanic and continental plates. One plate is thrust or subducted under the other plate so that a deep ocean trench is produced. In the Philippines, ocean trenches are associated with curved volcanic island arcs on the landward plate, for example the Java trench. Along the Peru-Chile trench, the Pacific plate is being subducted under the South American plate, forming the Andes mountains. This type of earthquake can be shallow, intermediate, or deep, according to its location on the downgoing lithospheric slab. Such inclined planes of earthquakes are know as Benioff zones. The fourth type of seismic zone occurs along the boundaries of continental plates. Typical of this is the broad swath of seismicity from Burma to the Mediterranean, crossing the Himalayas, Iran, and Turkey, to Gibraltar. Within this zone, shallow earthquakes are associated with high mountain ranges where intense compression is taking place. Intermediate- and deep-focus earthquakes also occur and are known in the Himalayas and in the Caucasus. The interiors of continental plates are very complex, much more so than island arcs. For instance, we do not yet know the full relationship of the East African rift system to the broad picture of plate tectonics. Paleogeography: plate distribution over time
Whereas geologically-speaking we are mainly concerned about very short-term changes (tens to hundreds of years) in Global Change, we get a good appreciation of nature's processes and awesome forces by looking at the geologic record. The animation displays the position of the continents over the past 150 Ma, from the breakup of supercontinent Pangea that formed the Atlantic Ocean to today (make your own reconstruction at the ODSN site). Regardless of the changes that will affect us in the next century, the plates will continue their journey. Small as the displacement may seem (the plates move at about the rate that your hair grows), the forces generated are very large and the natural hazards that they produce will remain to be enormous. There's no messing with nature in the long run.
The consequence of this process is the characteristic age variation of the ocean floor, seen in the figure. The youngest rocks (few Ma) are shown in red, whereas the oldest rocks (150-200 Ma) are shown in blue.
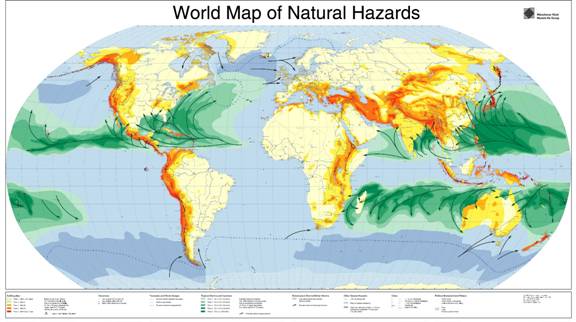
Earth’s Natural HazardsOur society is under daily threat from natural disasters. The common hazards include earthquakes, volcanoes, floods, storms and coastal surges that are illustrated in Figure X. The global map shows distinct patterns in their occurrence that can be explained by an understanding of the underlying processes. In this section we focus on two types of hazards, earthquakes and volcanoes, that can be explained by the process of plate tectonics. Plate tectonics offers a global framework for the occurrence of the planet’s earthquake and volcano hazards. Figure X shows that the distribution of major earthquakes and volcanoes mostly coincide with today’s plate boundaries. This connection offers a framework for prediction and mitigation efforts that will be explored after we discuss the origin and processes of these hazards.
Figure X. Recent earthquakes (yellow) and volcanoes (red) of the world plotted against tectonic plate boundaries. 2.3.1 EarthquakesWatching the evening news, we regularly hear about the latest occurrence of an earthquake somewhere in the world. Table X shows some examples of past and recent earthquakes and their human and financial toll. While mostly focusing on the human toll, earthquakes have a growing societal impact from their associated cost, to which we return later. Media reports always mention the magnitude of an earthquake, which seemingly equates with the impact of this natural disaster. But is this true and what is the science behind this information? The largest earthquakes are listed below, but you can select do your own criteria for past earthquakes through NOAA's Earthquake database.
The catastrophic displacement of fault along plate boundaries is the origin of large earthquakes. Consider bending a wooden pencil until it snaps. The ability to bend is an elastic property of the material, and when it snaps you have exceeded its elastic limit. The same applies to geological materials. Rock are able to accumulate a small amount of elastic energy, what we call elastic limit. When processes exceed this energy, the rock breaks, like bending the pencil. In the case of preexisting faults, the elastic limit of rock is even less, and displacement will occur with relative easy and commonly. These fault displacements can be gradually or intermittently. In the former case we speak of aseismic slip, while in the latter case the displacement is seismic. The moment of seismic slip, when the elastic limits is exceeded, is the origin of an earthquake. The more energy released, the greater the earthquake magnitude, and the greater its impact. The location of an earthquake in the Earth, where the energy release occurs, is called the focus of an earthquake. The point at the surface straight above the focus is called the epicenter. Practically, the epicenter is most important for societal impact, as it marks the position where energy release at the surface is largest. This highlights an important aspect of seismicity, where large earthquake can be less damaging than smaller earthquakes when the latter are closer to the surface. The earthquake intensity scale captures this impact. IntensityThe effect of an earthquake at the Earth's surface is called the intensity. The intensity scale consists of a series of certain key responses such as people awakening, movement of furniture, damage to chimneys, up to total destruction. Although numerous intensity scales have been developed over the last several hundred years to evaluate the effects of earthquakes, the one most commonly used is the Modified Mercalli (MM) Intensity Scale. This scale, composed of 12 increasing levels of intensity that range from imperceptible shaking to catastrophic destruction, is designated by Roman numerals. It does not have a mathematical basis; instead it is an arbitrary ranking based on observed effects.
A better measure of earthquake is their magnitude, which utilizes seismometers to quantify the ground shaking. MagnitudeSeismographic systems amplify and record the ground motion of earthquakes (typically at periods of between 0.1 and 100 seconds) as a function of time. In the 1930's, Charles F. Richter introduced the concept of earthquake magnitude. By knowing the distance between a seismograph and an earthquake, and measuring the maximum signal amplitude recorded on the seismograph, a quantitative ranking of the earthquake's size can be made.
Figure X. Schematic seismogram showing arrivals of different wave types and their characteristics Let's look at a typical seismogram (Figure). You will notice that there are times of wide swings of the recorder against a background of small amplitude. Amplitude describes the distance between the average background and the maximum swing of the needle. The pattern falls into two components: an initial series of swings followed by slowly diminishing activity, then a second wave of greater amplitude. If the station is sufficiently close to the earthquake source region, we find that the needle continues to move even after this second wave of activity. These pulses of activity record different types of waves that originate from an earthquake. Those arriving first are called P-waves, for Primary waves, whereas the second pulse of waves are called S-waves. P- and S-waves represent different atomic interactions in materials. P-waves briefly compress neighboring atoms, after which they relax and transfer the energy to neighboring atoms. S-waves represent a brief shear motion between atoms, which relaxes and is passed on.
The amplitude of the pattern is used to quantify the magnitude of an earthquake, using the formula M = log (A/T) + (source distance function) ; with A is amplitude and T is time. The source distance function is a correction factor for an individual seismic station. Because the scale is logarithmic, each ground motion unit represents an earthquake that is 10 times larger. But seismologists discovered that earthquakes radiate their energy over different time periods. As the amount of energy radiated by an earthquake is a measure of the potential for damage, seismologists also use radiated energy to describe the effects of an earthquake. Estimates of energy use the relationship, log10E = 11.8 + 1.5M. For example, an M=5 earthquake generates 2 x 10¹⁹ ergs, which is roughly equal to one atom bomb (or 20,000 tons TNT). A M=6 earthquake generation 6 x 10²⁰ ergs, which is roughly equal to a hydrogen-fusion bomb, and~30x greater than a M=5 earthquake. This explain the rapid increase in destructive power of earthquakes as their magnitude only slightly increases. Comparing earthquake magnitude and energy released:
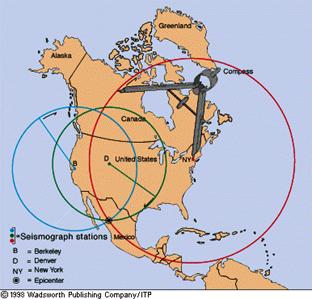
Because P-waves move faster than S-waves, the time between the arrival of P- and S-waves will increase as the distance of the earthquake to the recording station increases. From this P-S travel time difference we determine the distance of the earthquake to the seismometer. We need this information from minimally three stations to determine an earthquake’s location, as shown in Figure X. The intersection between three or more distance circles on the Earth’s surface defines the epicenter. Today, many seismic station are connected, so location (and magnitude) are rapidly determined, allowing warning systems for secondary effects, such as landslide and tsunami potential that are often responsible for the great loss of life.
|
|
Volcano |
When |
Deaths |
Major Cause of Death |
|
Tambora, Indonesia |
1815 |
92,000 |
Starvation |
|
Krakatau, Indonesia |
1883 |
36,417 |
Tsunami |
|
Mt. Pelee, Martinique |
1902 |
29,025 |
Ash flows |
|
Ruiz, Colombia |
1985 |
25,000 |
Mudflows |
|
Unzen, Japan |
1792 |
14,300 |
Volcano collapse, tsunami |
|
Laki, Iceland |
1783 |
9,350 |
Starvation |
|
Kelut, Indonesia |
1919 |
5,110 |
Mudflows |
|
Galunggung, Indonesia |
1882 |
4,011 |
Mudflows |
|
Vesuvius, Italy |
1631 |
3,500 |
Mudflows, lava flows |
|
Vesuvius, Italy |
79 |
3,360 |
Ash flows and falls |
|
Papandayan, Indonesia |
1772 |
2,957 |
Ash flows |
|
Lamington, Papua N.G. |
1951 |
2,942 |
Ash flows |
|
El Chichon, Mexico |
1982 |
2,000 |
Ash flows |
|
Soufriere, St Vincent |
1902 |
1,680 |
Ash flows |
|
Oshima, Japan |
1741 |
1,475 |
Tsunami |
|
Taal, Philippines |
1911 |
1,335 |
Ash flows |
|
Agung, Indonesia |
1963 |
1,184 |
Ash flows |
|
Pinatubo, Philippines |
1991 |
800 |
Roof collapses and disease |
|
Hibok-Hibok, Philippines |
1951 |
500 |
Ash flows |
|
Mt. St. Helens |
1980 |
100 |
|
Magma formation
With depth in Earth, the ambient temperature (and pressure) increase, which is called the geothermal gradient. At first it increases by 20-30C/km, but below 15 km the increase becomes less. At the crust-mantle boundary, located ~40 km depth, the temperature is 700-800C, whereas at the core-mantle boundary, at ~3000km, the temperature is about 4000C. Temperature increase typically changes the state of matter from solid to liquid to gas. But pressure opposes this phase pattern, such that increasing pressure will tend to keep matter in a more dense form. In earth, the gradual increase in pressure results in solid mantle, but at temperatures that would produce melt at the surface.
We examine this behavior in a schematic diagram that plots the stability fields of solid and liquid for a representative mantle rock, indicated by the black circle. The melting curve, the line that separates solid from liquid has a positive slope, meaning that larger pressures require larger temperatures for melting to occur. When heating a solid without changing the pressure, the position of the circle moves toward the melting curve, eventually entering the melt field. Similarly, decreasing the pressure while maintaining the temperature moves the circle into the melt field. So, melting occurs when we increase temperature or when we reduce pressure. In terms of our planet, this means an added source of heat will change solid mantle to liquid, when the material is already close to the melting curve. Similarly, bringing relatively hot mantle rock to the surface will result in melting without requiring additional heat. These two conditions explain the occurrence of volcanism around local mantle hotspots, such as Hawaii and Yellowstone, and volcanism at divergent plate boundaries. A third process that induces melting is the addition of water that weakens the atomic structure of solids, shown in the Figure Xb. The melting curve for dry rocks lies at higher temperatures than that for wet rocks, so the initial solid may become a liquid in the presence of water. This condition occurs at convergent plate boundaries, where metamorphic dehydration reaction (water-producing mineral reactions) release water that promites melting in previously dry host rock. Volcanoes of the Pacific Rim are mostly formed in this manner. Collectively, the occurrence of volcanoes is explained by these three processes that are rooted in plate tectonics.
Returning to the location of Earth's ~500 recently and currently active volcanoes, we find that they occur in regions that reflect the role of one of these melting mechanisms. Hawaii is an example of heating, Iceland in the North Atlantic Ocean is an example of depressurizing, and the South American Andes result from water addition.
Monitoring
With their location well-constrained, today’s eruptive potential of volcanoes is monitored by precursor activities. Particularly changes in shape of volcanoes, inflating due to the rise of expanding magma, microseimicity from subsurface displacement and changing volcanic-gas composition may indicate major activity. Whereas these indicators do not assure imminent eruption, they allow for timely evacuation and mitigation strategies. The nature of the eruption varies from slowly creeping lava flows to explosive volcanism. The shape of volcanoes is one indicator of these eruptive properties. Low-viscous magma producing volcanoes result in large volcanic structures with limited relief called shield volcanoes; for example, Hawaii. Magma that is more viscous, meaning stickier, builds steep edifices, called shield volcanoes, that often produce explosive eruptions; for example, Mt. St. Helen’s. Geologists are able to predict this behavior from chemical analysis of erupted magma, with high Si producing increasingly stickies magma, increasing the risk for explosive activity.
The activity of earthquakes and volcanoes is often accompanied by events that greatly increase the human impact. Particularly tsunamis and landslides have historically been responsible for great loss of life. Tsunamis form when sudden ocean floor movement displaces a large volume of water that travels away from the source. When this fast moving, large mass of water reaches shallow water conditions, the waves slow down and increase in height, resulting is major coastal surges and inland flooding. The impact of a large underwater earthquake is therefore much greater than ground-shaking, as recently demonstrated by the 2004 Sumatra earthquake and tsunami. Any sudden movement of the surface will cause a tidal wave, so collapse of the flanks of ocean islands or coastal margins can similarly have a large regional impact.
Groundshaking that causes destruction of building also destabilizes natural hillslopes, resulting in large landslides and mudflows. Especially mudflows are capable of covering large areas and cause major loss of life and environment.
Societal Impact
We have measured most of the impact of natural hazards in human life, which is exacerbated by population trends of the last 100 years. First, the rapid increase in world population means that hazards affect increasingly larger numbers of people. Plotting major hazards against today’s population shows that some of the most populated areas, such as China, India and Indonesia have very significant hazard risk. Second, the growing urbanization of the 20thC will result in >50% of the world’s population in (mega)cities. Many large cities are build in hazardous areas, which will affect larger concentrations of people and generate huge logistical problems for mitigation. Many of these densely populated regions occur in countries where people have low income where sudden changes in living conditions cannot be easily accommodated by individual and by their governments.
Even relatively rich, developed nations will face new challenges from the sheer cost of natural disasters. The expense of these events has increased exponentially in the last several decades, which means that expensive choices about rebuilding and improving infrastructure will have to be made. For example, the moderate 1994 earthquake in California (Northridge) carried a price tag of $30billion, while responsible for only ~60 fatalities. In contrast, the 2004 Sumatra earthquake cost is estimated at ~$10billion, but was responsible for >150,000 deaths. Today’s governments are mostly reactive to natural catastrophes, but, beside the human suffering, these events will increasingly affect the global economy. The well-being of the world’s citizens demands a more proactive stand of its leaders, both in wealthy and in poor nations.
All materials © the Regents of
the University of Michigan unless noted otherwise.