In this lesson we will learn:
Current ClimateBefore moving on to the future climate, we need a better understanding of Earth's current climate. Climate differs from weather in that it provides a statistical view of seasonal and daily weather events over a long term period. Thus, for example, the passage of a large rain storm in a frontal system over Ann Arbor is a weather event, while the average number of such passages for the month of July (averaged over several years) is part of the climate record. Therefore, climate is the long-term average of weather. As we shall see, it is much easier to predict the climate (based on long-term statistical averages) than it is to predict any single weather event (short-term and highly variable). As an example of this, consider the flipping of a coin. How many of you would make the bet that if I have a coin and flip heads you receive an A in the course and you don't have to attend any more lectures or finish any more assignments; but, if I flip tails you receive an F. Would you take that bet? Of course not, because there is too much variation in predicting the outcome of a single event (such as, will it rain for sure today?). On the other hand, if I flipped the coin 1000 times, would you make the bet that on average, over the long term (1000 flips), the ratio of heads to tails would be 50/50 or very close? Of course you would, because it is much easier to predict the outcome of long-term statistical averages. And so it is with climate change. We know that summers in the future will be warmer than springs and falls with certainty (based on long term averages), and we know from our understanding of the physics that control the mixing and interaction of the atmosphere and ocean, and that control the response of the atmosphere to increasing greenhouse gas concentrations, that summers in the future will be hotter than they are today, and overall we will be living in a much warmer world in the future. The full story of these predictions will be given below in the section on Climate Models. In the meantime, in case you are interested, the long-term climate data averages for Detroit are listed in Table 1. Climate records are most often expressed in terms of temperatures, winds, precipitation, and pressures - all parameters that can be measured at multiple sites around the globe, and that can be used to describe the physics that drive weather (e.g., storms) and climate (e.g., long-term trends in temperature). Over the years a large database of weather event measurements has been obtained, leading to a very good description of today's climate. This database is what is used in the Global Climate Models (GCMs) that predict future climate on Earth, which we will discuss below. TABLE 1. Climatological monthly temperatures and precipitation for Detroit, Michigan.
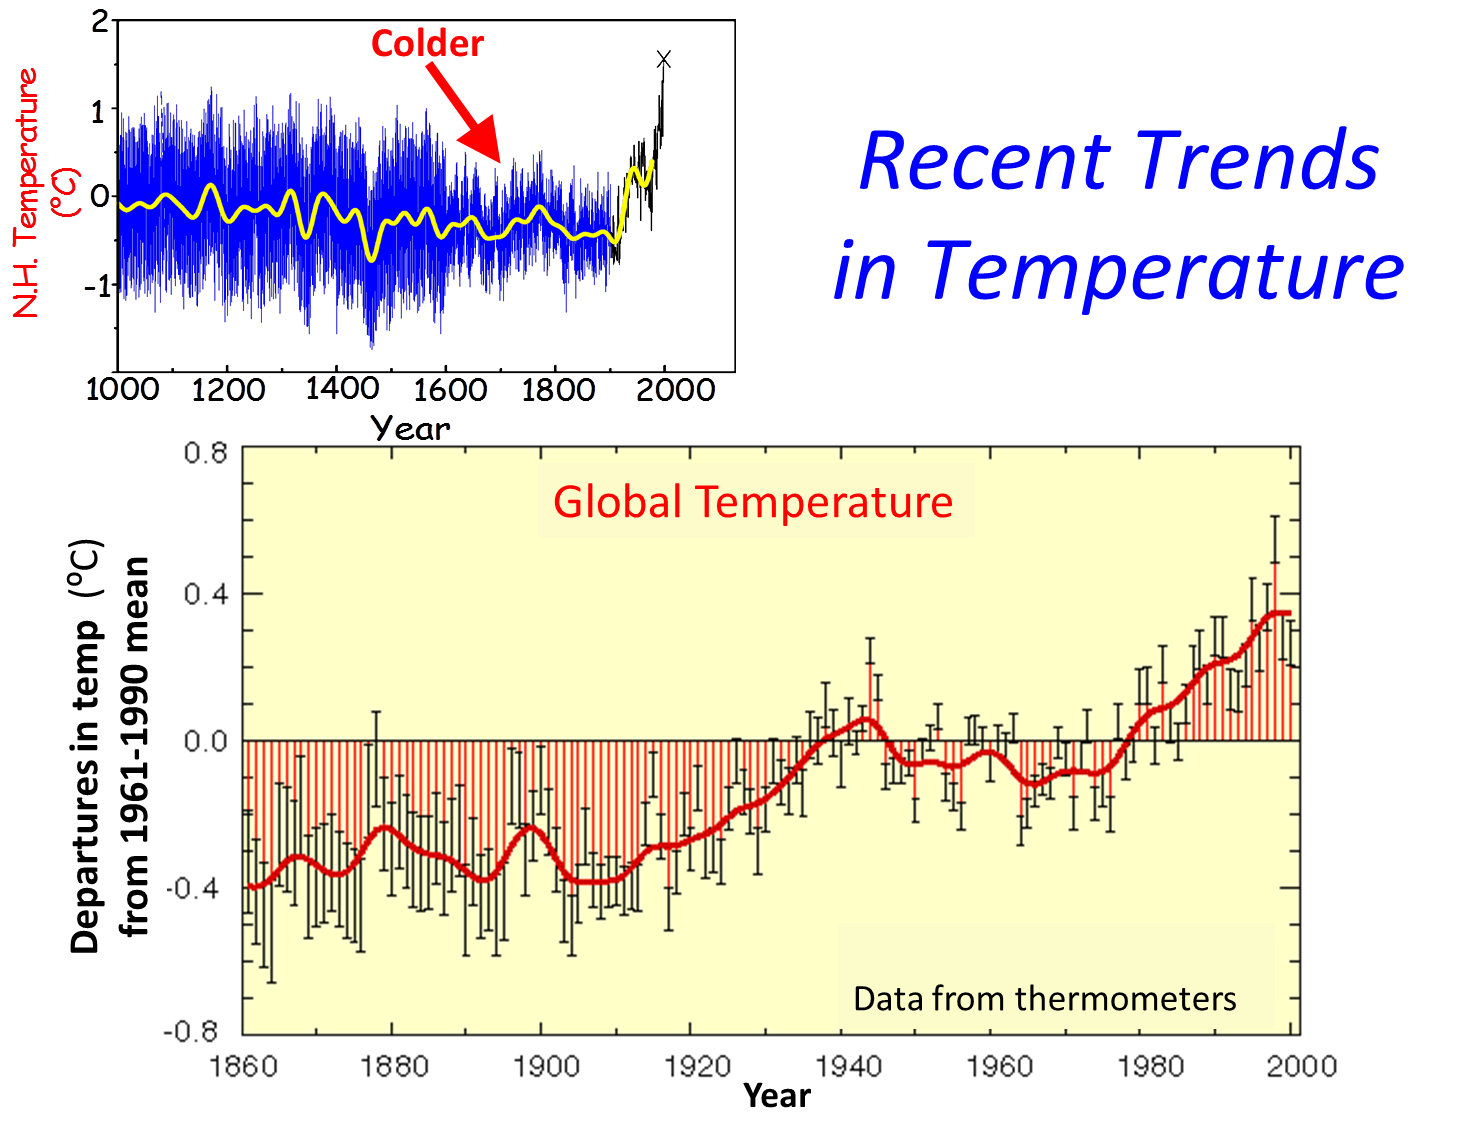
Recent Trends in ClimateThe global average surface temperature has increased by 0.6 ±0.2°C since the late 19th century (IPCC, 2001). The year 2015 was easily the warmest ever on record, in part due to the strong El Nino conditions of 2015-2016. However, this also marks the fourth time since 2000 (the 21st century) that a new record high annual temperature has been set (along with 2005, 2010, and 2014) and also marks the 39th consecutive year (since 1977) that the annual temperature has been above the 20th century average. To date, including 2015, 15 of the 16 warmest years on record have occurred during the 21st century (NOAA NCDC 2016; and see Figure 1). As indicated in Figure 1, most of the increase in global temperature since the late 19th century has occurred in two distinct periods: 1910 to 1945 and since 1976. The rate of increase of temperature for both periods is about 0.15°C/decade. Recent warming has been greater over land compared to oceans; the increase in sea surface temperature over the period 1950 to 1993 is about half that of the mean land-surface air temperature. The high global temperature associated with the 1997 to 1998 El Niño event stands out as an extreme event, even taking into account the recent rate of warming. Note also the relatively low temperature in the upper left of Figure 1 that highlights the period known as the "Little Ice Age" (red arrow).
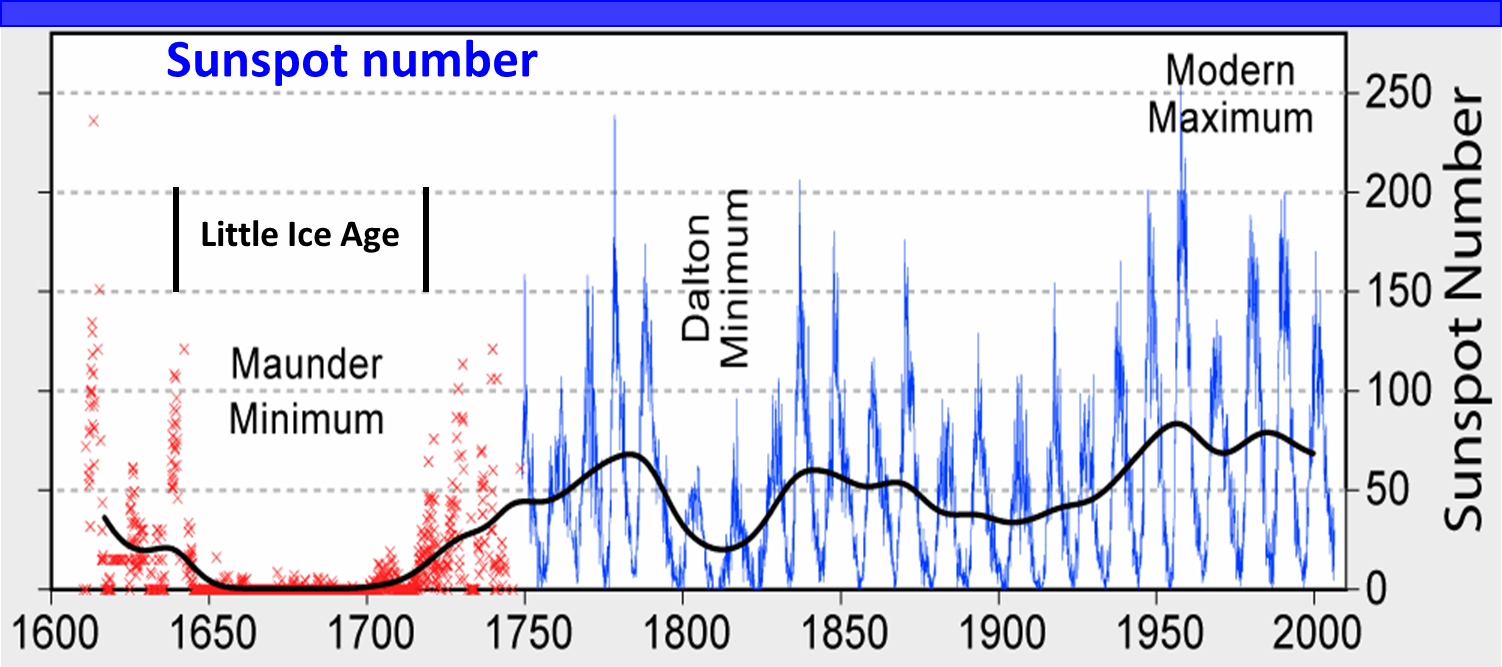
Figure 1: Recent trends in temperature on Earth. Two standard error uncertainties are shown as bars on the annual number [from IPCC, 2001]. One of the most common cries of the climate skeptics, those that hold fast to the belieft that the climate is not changing, or even if it is changing it is patently absurd to think that humans have anything to do with it, is that "it's all due to sunpots and volcanoes!" Let's take a closer look at both of those arguments. The "sunspots argument" is based on two observations. First, the Little Ice Age corresponds to a period of time from about 1650 to 1720 when there were very few recorded sunspots (Figure 2). And because sunspots are large eruptions of energy from the sun's surface, it was thought that more sunspots warmed the Earth. Second, a small subset of data showed an increase in sunspot number from about 1890 until 1950 (see Figure 2), roughly at the same time that the temperature of the Earth was increasing as well (see Figure 1), and this "cherry-picked", incomplete set of data showed a correlation between sunspots and temperature. However, when one looks at the full record of data in Figure 2 it is clear that there is no strong increase in the number of sunspots over time, while the temperature has been consistently increasing (Figure 1). In addition to this lack of correlation between sunspots and warming, scientists have also determined that the amount of energy from the change in sunspots is only about 0.1% of that required to explain the global warming. In other words, even if the sunspot number had been increasing, there isn't enough power in the sunspots to warm the Earth as fast as it has warmed. Although this sunspot argument is still used today by those who wish to deny climate change for personal profit or political gain, looking at all the data and "the scientific facts" has shown it to be clearly wrong.
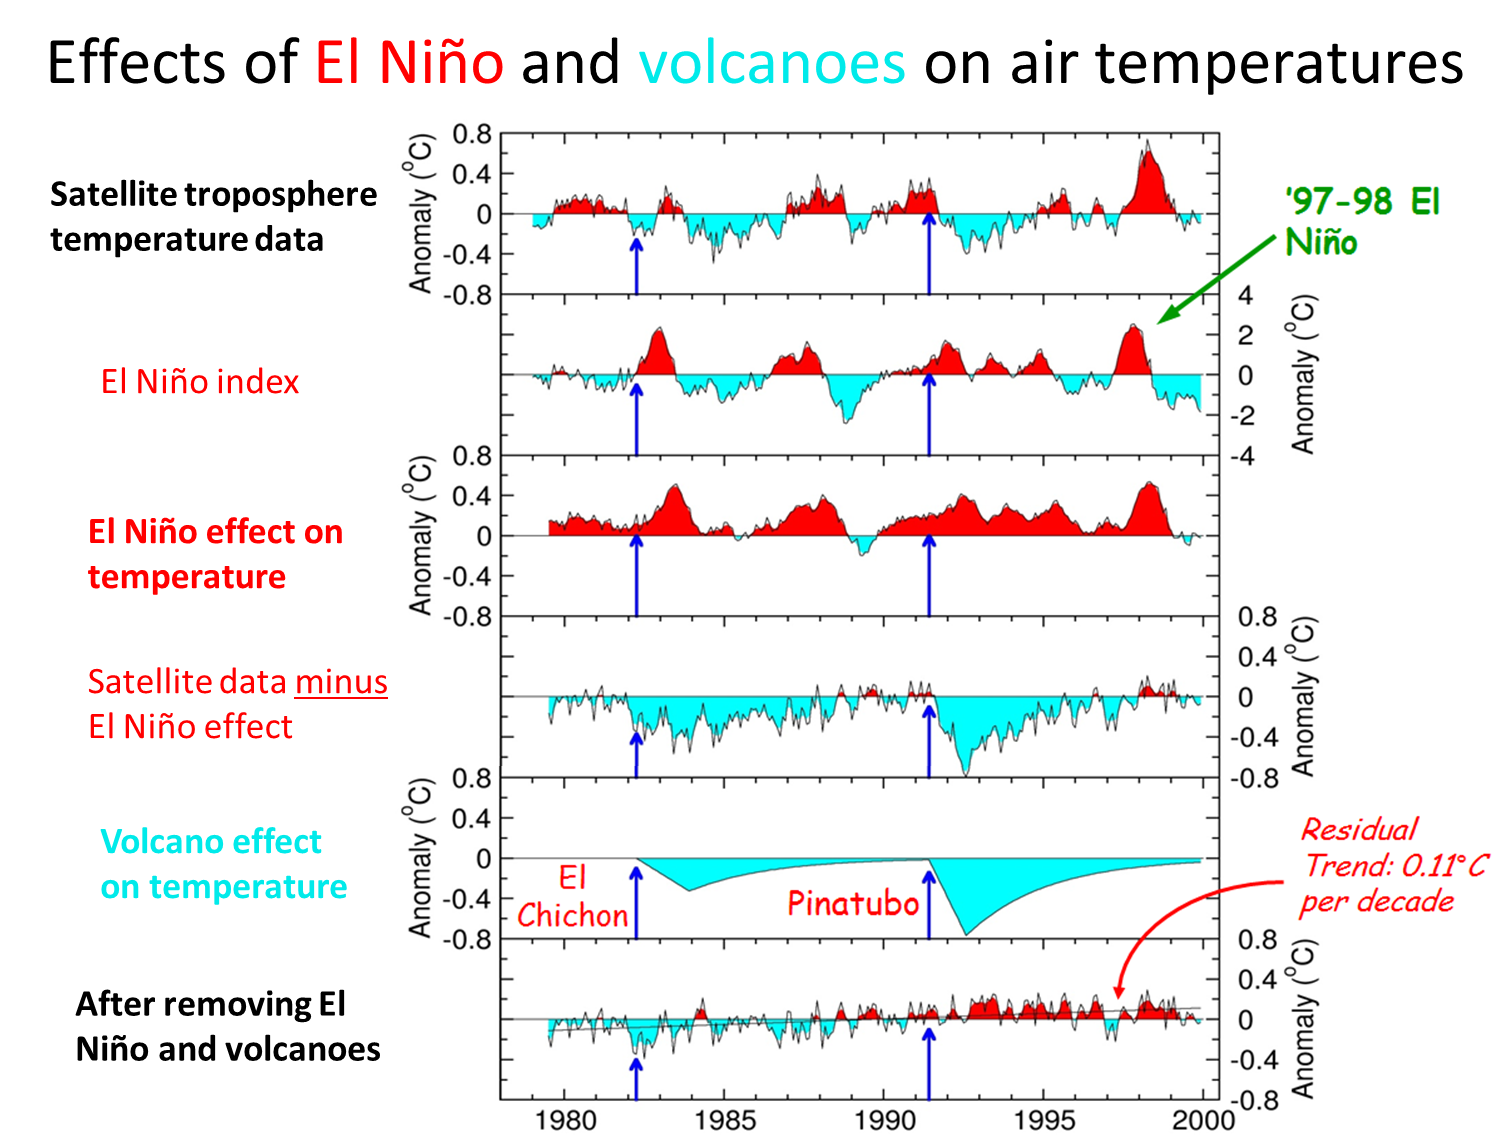
Figure 2: Sunspots recorded for the last 400 years, showing the 11 year cycle clearly visible in the more recent (better resolution) records. The Little Ice Age (also known as the Maunder Minimum of sunspot activity) is shown. We know that volcanoes spew out CO2 to the atmosphere, and in previous lectures we learned how over very long time scales (tens to hundreds of millions of years), plate tectonics shift continents and stimulate both volcanic activity and weathering on land, which increase and decrease (respectively) the amount of CO2 in the atmosphere. But on short time scales, even over the period of historical record, we know two things: first, we know that volcanoes actually cool the Earth's climate due to aerosols and dust put into the atmosphere, and second we know that on average volcanoes put out about 160 times less CO2 than do humans each year. In other words, volcanoes and volcanic activity have nothing to do with the warming of the Earth we have measured in the last 150 years. The combination of effects on air temperatures from El Ninos (see the Blue Planet lecture) and volcanoes is illustrated in the following graph (Figure 3). Here we see that El Nino's warm the planet, while volcanoes cool the planet. When you "subtract out" the warming effect of El Ninos, you are left with two strong cooling events during the time from 1980-2000 (the 4th panel down in Figure 3). These two cooling events are the result of large volcanic explosions at El Chichon (1982) and Pinatubo (1991). When these two cooling events are "subtracted out" from the record along with the El Nino effect, you see in the bottom panel that there has been a warming of about 0.11 deg C per decade, which is what has been observed. This warming is due to the greenhouse gases that humans have dumped into the atmosphere, not to volcanoes or El Nino events.
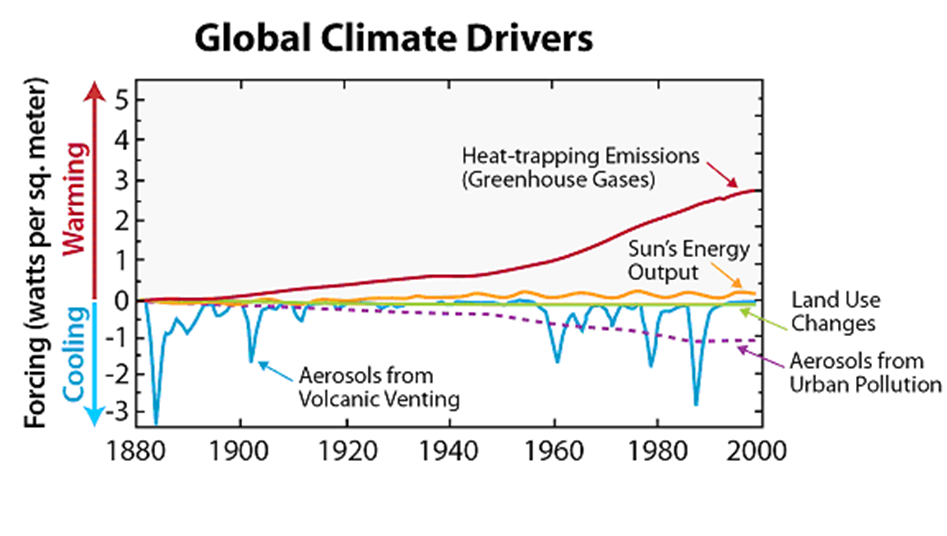
Figure 3: Recent trends in temperature on Earth. Two standard error uncertainties are shown as bars on the annual number [from IPCC, 2001]. Another way of viewing these "attributions" of warming to different causes is to calculate the "forcing" in terms of Watts per meter squared of Earth's surface, a standard measure of energy that allows one to compare different drivers that drive climate change (Figure 4). Analyzed in this way it is clear that greenhouse gases are the dominant driver that is forcing climate warming in recent times.
Figure 4: Attributions of the effects of different forcing variables on Earth's climate. The forcing of climate (either warming or cooling) is compared using the amount of energy (Watts/m2) for volcanic aerosols, urban pollution aerosols, solar output (i.e., sunspots), land-use changes, and from greenhouse gas emissions to the atmosphere [from Hansen et al. 2005].
Climate Models
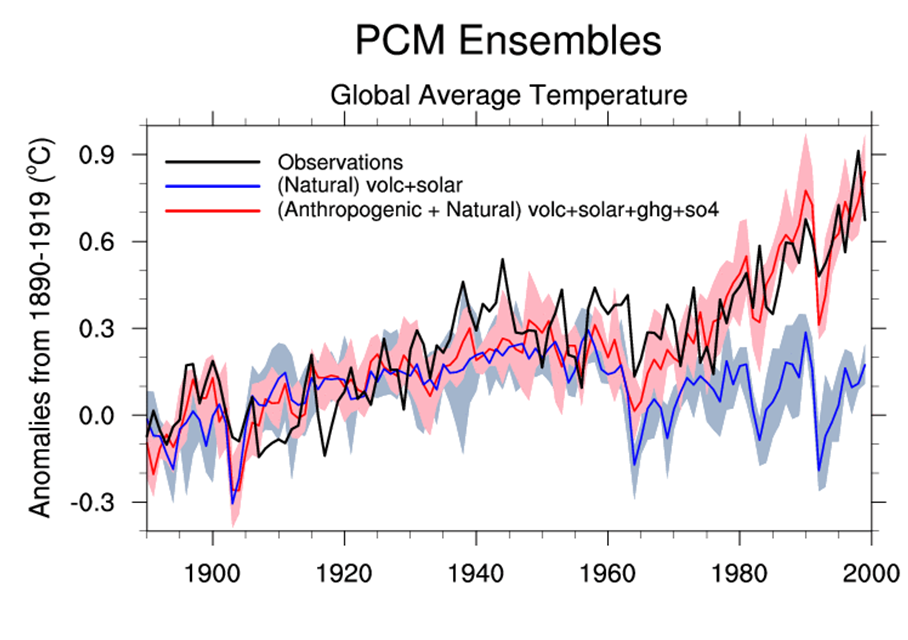
A number of sophisticated global climate models (GCMs) have been developed over the past 30 years for the purpose of predicting future climatic change. (Note that at the beginning of the development of these models, the shorthand "GCM" stood for General Circulation Model.) The most highly developed models are three-dimensional and time dependent and divide the globe up into a series of interacting boxes that include many layers in the atmosphere and in the oceans. The reservoirs and fluxes of importance are coded into the computer program, which then solves the conservation equations of mass, momentum, and energy in order to calculate the evolving state of the atmosphere-hydrosphere system. In general, models such as these must be validated against observations. This is done sometimes by running the model to predict specific known climates that have occurred in the past. This is done by starting with input data for the year 1950, in part because the climate data from that time forward are particularly complete and detailed. As the model runs forward in time it outputs its "predicted" climate, which can be then easily checked against what actually happened. If the predictions match the actual observations then the model is considered to correctly simulate all of the main climatic processes and equations, and the model then continues to run into the future. If the predictions for past years don't match what actually happened, then the model is developed further. However useful, these predictive models have to constantly checked against experimental data to insure accurate results. Another advance in climate modeling has been the use of several models run in "parallel", or essentially an ensemble of models running together to make joint predictions of climate through time. One of these ensemble climate model efforts was used to convincingly show that without the influence of human inputs of greenhouse gases, the climate models would fail to predict our recent warming. In other words, as shown in Figure 5, the climate models predicted past, observed temperatures (black line) well using only "natural" variation from volcanic and solar forcing starting before 1900. However, in about 1960 the model predictions using only these natural forcings failed to match the observed temperature increases (Figure 5). Only by adding in the human forcings of greenhouse gases and sulfate aerosols were the models able to match the observed temperatures. These results provide us with great confidence in how the models operate and in their ability to match temperatures in the past (hindcasting) as well as predict temperatures in the future.
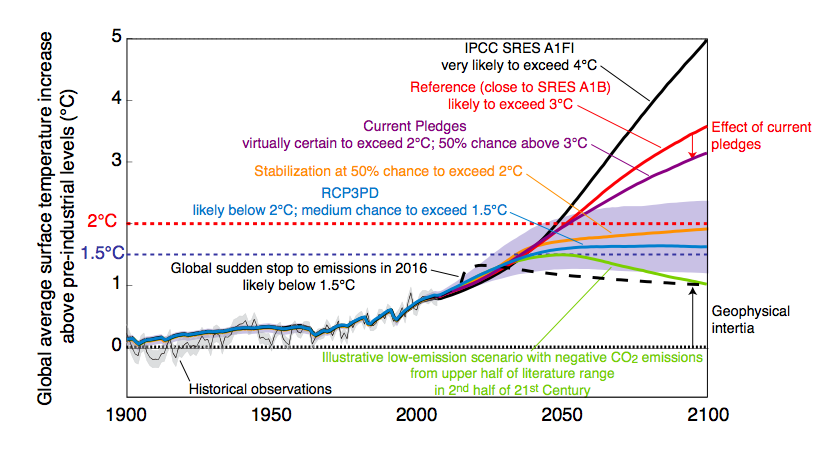
Figure 5: Climate reconstruction using an ensemble of models that separate the contributions from natural climate forcing (volcanic and solar variations) from anthropogenic forcings (greenhouse gases and sulfate aerosols). Note that only when the human-driven changes are incorporating do the models reproduce the actual observations of temperature change that have already occurred. Meehl, G.A., W.M. Washington, et al. 2004. Combinations of natural and anthropogenic forcings and 20th century climate. J. Climate, 17: 3721-3727. Emissions Scenarios. Because of this strong forcing of climate by greenhouse gases, the most important consideration for predicting future climate is to estimate how much greenhouse gas humans will emit to the atmosphere. These estimates are called SRES estimates, which stands for Special Report on Emissions Scenarios that were produced by the IPCC. These scenarios include situations such as "business as usual", A1F1, where we do nothing to alter our consumption of energy on the planet, which of course results in the most drastic predictions of warming or sea level rise. Other scenarios all account for various strengths of efforts that we might make to curb our use of fossil fuels. Thus we see that most of the "variability" in the prediction of future temperature increases lies not with the models themselves, but with which emission scenario is chosen. This is good from the standpoint that our destiny is in our own hands, and we do not have to live with the most drastic temperature increases if we can essentially get our acts together and reduce our greenhouse gas emissions to the atmosphere.
Figure 6: Predicted global temperature increases by the end of this century given various emission scenarios [https://www.carbonbrief.org/future-climate-projections-five-graphs-from-three-reports] 1. Recent changes in Earth's paleoclimate record are likely due to shifts in ocean circulation and most importantly the effects of greenhouse gas increases. Volcanoes have had only a small effect (cooling), and the sunspot record cannot account for the heat input needed. 2. Temperature changes and greenhouse gas abundances are correlated. Rapid global warming is underway and models have been developed to predict the effects of these changes. 3. Global Climate Models (GCMs) are sophisticated tools with ever-increasing realism, and that depend on different greenhouse gas "emission scenarios" that estimate the amount of greenhouse gases our global society will put into the atmosphere in the future. If we continue on a "business as usual" scenario trajectory, these climate models predict a much altered climate on Earth by the end of this century. Review
All materials © the Regents of the University of Michigan unless noted otherwise.
|
||||||||||||||||||||||||||||||||||||||||||||||||||||||||||||||