The Global Water and Nitrogen Cycles
(R. Robarts & R. Wetzel, SIL News V. 29, Jan 2000) Jump to: [Global
Water Cycle] [Global Nitrogen
Cycle] [Self-Test]
The water cycle contains the largest chemical flux on earth. Water distributes heat around the globe and thus creates climate, and water is the single most important factor regulating land-plant productivity worldwide. Without water life would not exist (perhaps on ANY planet), and despite the fact that 70% of the earth's surface is covered with water, that water is salty and can't be used for drinking, agriculture, or industry. Only about 0.014% of the water at earth's surface is useable by plants, humans, and other animals. In attempting to understand element cycles as part of the major functioning of ecosystems, it is useful to follow a specific "approach". This general approach was followed in the previous lecture on the carbon cycle, and it can be used to help understand any element cycle. It consists of 3 parts and is formally outlined below:
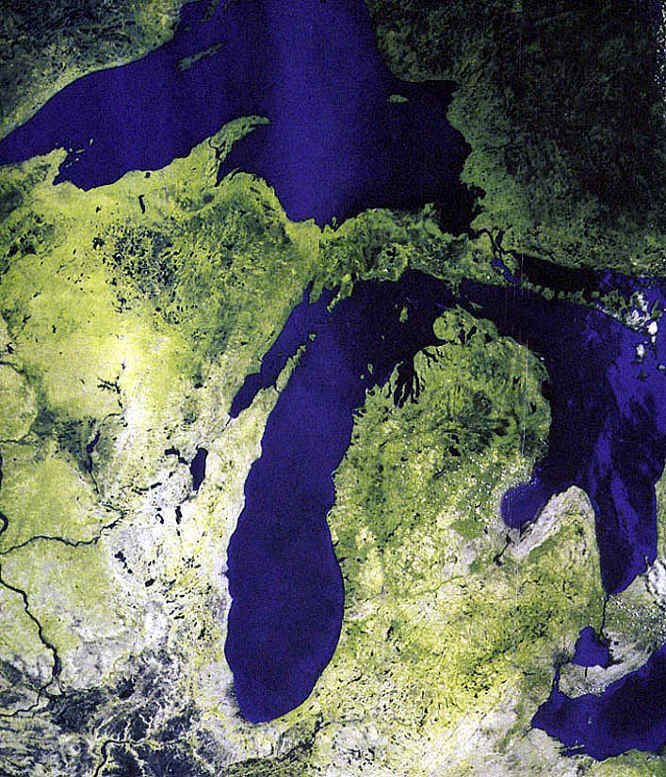
As you can see from the Table and from Figure 2, most of the water on earth is tied-up in rocks and unavailable. Of the water that is at the surface of the earth and available for cycling, only a very small percentage is fresh water. Of that fresh water, about 20% is contained solely in the Laurentian Great Lakes in North America (Figure 1), and another 20% is contained in a single lake in Siberia, Lake Baikal.
There are 4 major pathways of cycling in the global water cycle (Figure 3): precipitation, evaporation, vapor transfer from ocean to land, and return flow in rivers and groundwaters from land to oceans. The following gives the flux of these different pathways:
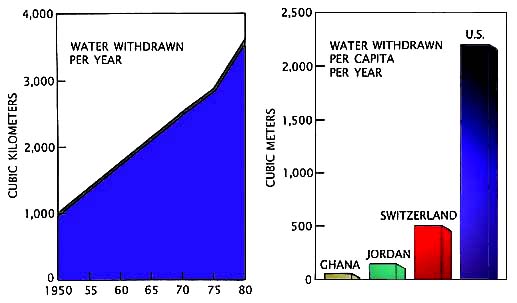
ControlsThere are several major controls on the water cycle, including human consumption, temperature increases, and land use changes.(A). Human consumption. The consumption of water by humans has increased dramatically since the industrial revolution, and today water is a critically lacking resource in certain areas such as deserts and semi-deserts. In addition to this local vulnerability, it is quite likely that water shortages due to human consumption will occur at the regional scale in the near future. For example, the southwestern United States (in all seriousness) has proposed to "buy" water from the Great Lakes states and build a pipeline from Lake Michigan -- so far Michigan, Wisconsin, and other nearby states and Canadian provinces have declined such offers.
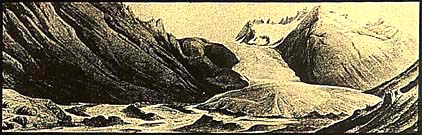
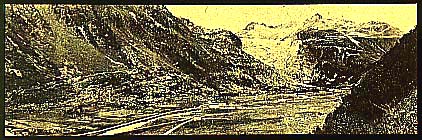
(B). Temperature. The second major control on the cycling of water on earth is temperature. Increasing temperature increases the rates of evaporation and ice melting, and causes sea level to rise. Severe droughts, like in the Sahel in Africa, are caused by small changes in the geographical distribution of water that are in turn caused by changes in temperature. In Figure 5 below there are some examples of the effect that increased global temperatures have had on glaciers in recent years.
2. Sea level rise. Sea level has been rising in the world in recent years. Figures 6 and 7 below show first how large these changes have been in various parts of the world, and second how much of this increase is due simply to the thermal expansion of water as temperature Increases. Figure 8 shows the effect of a rise of 4.7 m in sea level on Florida. Note that while 4.7 m may seem like a large increase, during the last glaciation sea level was a full 100 m lower than it is today; with that time perspective, a change of 4.7 m does not seem so large.
(C). Land use changes. Currently most of the land use changes on earth, such as deforestation, are at a local scale. However, it may soon become important at regional scales and for the entire globe in the future. For example, in a study done at Hubbard Brook in New Hampshire, run-off increased by up to 400% after deforestation. Nutrient cycles are strongly linked to hydrologic cycle, and so nutrient export was also increased. These increases are only temporary, however, and the likely end result of such land use changes is that precipitation will be decreased (this will be discussed in more detail in the upcoming lecture on the Tropical Rainforest), and soils will become less fertile. This illustrates one of the key points about element cycles, which is that they are most often linked and it is difficult to study them in isolation. In this example, we found that the water cycle strongly controls the nutrient cycling due to the transport of nutrients in runoff. In the next section we will examine the nitrogen cycle specifically as an example of a global cycle of an important nutrient. The cycling of nitrogen is different from the cycling of water in at least one important area, which is that the "forms" of nitrogen are more varied than the form of water, which is always H2O and in either a liquid, gas, or solid form. The nitrogen cycle is complex then in part because of the many chemical forms of N such as: Organic-N; NO3; NH4; and the gases N2, N2O, NO + NO2 (=NOx). Figure 10 below gives an overview of the global nitrogen cycle.
Accounting Just as we did for the water cycle, or first step in understanding the nitrogen cycle is to examine the distribution of N on earth. The Table below gives the distribution of N in x1015 grams. Notice that the largest pool of available N is in the atmosphere.
Cycling The pathways and the reactions involved in the nitrogen cycle are also more complicated than in the water cycle due, again, to the fact that there are different chemical forms. The major pathways are shown in Figure 10, and these pathways can be linked to specific chemical reactions that are listed below and shown in Figure 11.
Nitrogen Fluxes (with respect to the atmosphere). Given the information
above, we can calculate some of the fluxes of various nitrogen chemical
species and their residence times in the atmosphere. 1.
N2
output from the atmosphere = 158 x 1012 g / year (N-fixation) * RT
of N2 = 24.68 million years 2.
NOx
output from atmosphere = 60 x 1012 g / year * RT
of NOx = 0.01 yr = 3.6 days ·
Note
that small pool sizes of an element often mean that the component is
converted to something else quickly, or, that it is very
"reactive". Large pool sizes are difficult to "disturb";
an example is the pool of N2 gas in the atmosphere. Controls
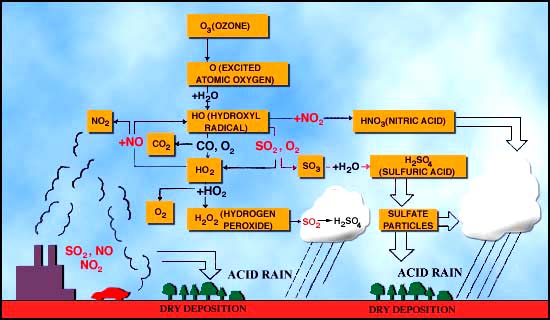
There are very many "controls" on the overall nitrogen cycle, but in this lecture we will focus on the controls that are related directly to a major environmental problem on earth, which is acid rain. The general way in which acid rain is formed is given in Figure 12 below.
·
NOx
- produced by combustion of fossil fuels and by industry. Important in
forming acid rain. 1.
NO + O3
(ozone) = NO2 2.
NO2
+ OH = HNO3 = "nitric acid" 3.
In water, HNO3
dissociates (breaks apart) to give H+ and NO3-
(note that the charges must balance, so there is one positive and one
negative charged ion after the dissociation.) ·
The
Second important reaction involved with acid rain is the formation of
sulfuric acid in the atmosphere. 1.
H2SO4
dissociates in water to give 2 H+ and SO42- . Effects of acid rain Figures 13 and 14 (below). Chemical reactions of acid rain components in soils.
By measuring the buffering capacity of soils, you can determine regions of sensitivity to acid rain, as is shown.
Summary
"ELEMENT CYCLES INTERACT" and they cannot be studied in isolation. All materials © the Regents of the University of Michigan unless noted otherwise.
|
|||||||||||||||||||||||||||||||||||||||||||||||||||||||||||||