 Earth's
Untamed Energy: Earth's
Untamed Energy:
Earthquakes and Volcanoes
In this lecture, we learn:
Jump to: [Earthquakes] [Intensity] [Earthquake Location and Magnitude] [Energy] [Earthquake Depth] [Earthquake Monitoring] [Volcanoes] [Magma Formation] [Volcanic Hazards] [Volcanoe Monitoring] [Summary] [Self-Test]
|
 Tsunami
animation
Tsunami
animation It hardly needs to be said that
natural hazards have devastating effects on society. The death and destruction
associated with earthquakes, volcanoes, tsunamis (tidal waves), hurricanes
and other natural phenomena is unbelievably large. Beside the tragedy of
loss of human life, natural hazards increasingly take their toll on the
economies of nations. Take the US, for example, where one or more natural
phenomena always threaten. Life in California occurs in the shadow of major
earthquake threats. Activity along the San Andreas Fault, which passes
through several major cosmopolitan areas, is a classic example. Elsewhere
along the Pacific coast of the US, volcanic activity is an additional threat.
The eruption of Mt. St Helen's in Washington State occurred in an isolated
area, with relatively minor loss of human life. An eruption of Mt Rainier,
on the other hand, poses a major threat.
It hardly needs to be said that
natural hazards have devastating effects on society. The death and destruction
associated with earthquakes, volcanoes, tsunamis (tidal waves), hurricanes
and other natural phenomena is unbelievably large. Beside the tragedy of
loss of human life, natural hazards increasingly take their toll on the
economies of nations. Take the US, for example, where one or more natural
phenomena always threaten. Life in California occurs in the shadow of major
earthquake threats. Activity along the San Andreas Fault, which passes
through several major cosmopolitan areas, is a classic example. Elsewhere
along the Pacific coast of the US, volcanic activity is an additional threat.
The eruption of Mt. St Helen's in Washington State occurred in an isolated
area, with relatively minor loss of human life. An eruption of Mt Rainier,
on the other hand, poses a major threat.

| Date | Location | Deaths | Magnitude | Comments |
| January 23, 1556 | China, Shansi | 830,000 | ||
| October 11, 1737 | India, Calcutta** | 300,000 | ||
| July 27, 1976 | China, Tangshan | 255,000* | 8.0 | |
| August 9, 1138 | Syria, Aleppo | 230,000 | ||
| May 22, 1927 | China, near Xining | 200,000 | 8.3 | Large fractures. |
| December 22, 856+ | Iran,Damghan | 200,000 | ||
| December 16, 1920 | China,Gansu | 200,000 | 8.6 | Major fractures, landslides. |
| March 23, 893+ | Iran, Ardabil | 150,000 | ||
| September 1, 1923 | Japan, Kwanto | 143,000 | 8.3 | Great Tokyo fire. |
| December 28, 1908 | Italy, Messina | 70,000 | 7.5 | Deaths from 70,000 to 100,000 (estimated); earthquake and tsunami. |
| September, 1290 | China, Chihli | 100,000 | ||
| November, 1667 | Caucasia, Shemakha | 80,000 | ||
| November 18, 1727 | Iran, Tabriz | 77,000 | ||
| November 1, 1755 | Portugal, Lisbon | 70,000 | 8.7 | Great tsunami. |
| December 25, 1932 | China, Gansu | 70,000 | 7.6 | |
| May 31, 1970 | Peru | 66,000 | 7.8 | $530,000 damage, great rock slide, floods |
| 1268 | Asia Minor, Silicia | 60,000 | ||
| January 11, 1693 | Italy, Sicily | 60,000 | ||
| May 30, 1935 | Pakistan, Quetta | 30,000 | 7.5 | Quetta almost completely destroyed. |
| February 4, 1783 | Italy, Calabria | 50,000 | ||
| June 20, 1990 | Iran | 50,000 | 7.7 | Landslides. |
* Official casualty figure--estimated
death toll as high as 655,000. + Note that these dates are prior
to 1000 AD; no digit is missing. ** Later research has shown that
this was a typhoon, not an earthquake.
Data compiled from several sources.
As we will further explore in plate tectonics, forces in the Earth create an environment where parts of the surface grind past other parts. The boundaries between such moving parts are called faults. It is the catastrophic displacement of a fault that generates an earthquake. Consider a piece of wood. You can bend the wood a little, until it snaps. The ability to bend is an elastic property of a material, and when it snaps you have exceeded its elastic limit. The same applies to geological faults. Rock are only able to accumulate a certain amount of elastic energy, what we call elastic strain energy. When you exceed this energy, the rock breaks, much like a ceramic plate breaks when it hits the floor. In the case of preexisting faults, the strength of the rock is even less, and displacement will occur regularly. These displacements can be gradually or intermittently. In the former case we speak of aseismic slip, while in the latter case the displacement is seismic. The moment of seismic slip, after the maximum strain energy is stored, is the origin of an earthquake. The more energy released, the greater the earthquake magnitude.
Before turning to the details of locating earthquakes and determining their magnitude, we need to establish two terms. The location of an earthquake in the Earth, where the actual strain energy release occurs, is called the focus of an earthquake. The point at the surface straight above the focus is called the epicenter. Practically, the epicenter is most important for societal impact, as it marks the position where energy release, and thus shaking, is largest. The position of maximum energy release is actually the focus, but if this region lies deep in the Earth, say 500 kilometers, the effect at the surface may be minor.
The effect of an earthquake on the Earth's surface is called the intensity. The intensity scale consists of a series of certain key responses such as people awakening, movement of furniture, damage to chimneys, and finally - total destruction. Although numerous intensity scales have been developed over the last several hundred years to evaluate the effects of earthquakes, the one currently used in the United States is the Modified Mercalli (MM) Intensity Scale. It was developed in 1931 by the American seismologists Harry Wood and Frank Neumann. This scale, composed of 12 increasing levels of intensity that range from imperceptible shaking to catastrophic destruction, is designated by Roman numerals. It does not have a mathematical basis; instead it is an arbitrary ranking based on observed effects.
The Modified Mercalli Intensity value assigned to a specific site after an earthquake has a more meaningful measure of severity to the nonscientist than the magnitude because intensity refers to the effects actually experienced at that place. After the occurrence of widely felt earthquakes, the Geological Survey mails questionnaires to postmasters in the disturbed area requesting the information so that intensity values can be assigned. The results of this postal canvass and information furnished by other sources are used to assign an intensity within the felt area. The maximum observed intensity generally occurs near the epicenter.
The lower numbers of the intensity scale generally deal with the manner in which the earthquake is felt by people. The higher numbers of the scale are based on observed structural damage. Structural engineers usually contribute information for assigning intensity values of VIII or above.
The following is an abbreviated description
of the 12 levels of the Modified Mercalli intensity scale.
| I. | Not felt except by a very few under especially favorable conditions. |
| II. | Felt only by a few persons at rest, especially on upper floors of buildings. |
| III. | Felt quite noticeably by persons indoors, especially on upper floors of buildings. Many people do not recognize it as an earthquake. Standing motor cars may rock slightly. Vibrations similar to the passing of a truck. Duration estimated. |
| IV. | Felt indoors by many, outdoors by few during the day. At night, some awakened. Dishes, windows, doors disturbed; walls make cracking sound. Sensation like heavy truck striking building. Standing motor cars rocked noticeably. |
| V. | Felt by nearly everyone; many awakened. Some dishes, windows broken. Unstable objects overturned. Pendulum clocks may stop. |
| VI. | Felt by all, many frightened. Some heavy furniture moved; a few instances of fallen plaster. Damage slight. |
| VII. | Damage negligible in buildings of good design and construction; slight to moderate in well-built ordinary structures; considerable damage in poorly built or badly designed structures; some chimneys broken. |
| VIII. | Damage slight in specially designed structures; considerable damage in ordinary substantial buildings with partial collapse. Damage great in poorly built structures. Fall of chimneys, factory stacks, columns, monuments, walls. Heavy furniture overturned. |
| IX. | Damage considerable in specially designed structures; well-designed frame structures thrown out of plumb. Damage great in substantial buildings, with partial collapse. Buildings shifted off foundations. |
| X. | Some well-built wooden structures destroyed; most masonry and frame structures destroyed with foundations. Rails bent. |
| XI. | Few, if any (masonry) structures remain standing. Bridges destroyed. Rails bent greatly. |
| XII. | Damage total. Lines of sight and level are distorted. Objects thrown into the air. |
The increase in the degree of surface shaking (intensity) for each unit increase of magnitude of a shallow crustal earthquake is unknown. Intensity is based on an earthquake's local accelerations and how long these persist. Intensity and magnitude thus both depend on many variables that include exactly how rock breaks and how energy travels from an earthquake to a receiver. These factors make it difficult for engineers and others who use earthquake intensity and magnitude data to evaluate the error bounds that may exist for their particular applications.
An example of how local soil conditions can greatly influence local intensity is given by catastrophic damage in Mexico City from the 1985, magnitude 8.1 earthquake centered some 300 km away. Resonance of the soil-filled basin under parts of Mexico City amplified ground motions for periods of 2 seconds by a factor of 75 times. This shaking led to selective damage to buildings 15 - 25 stories high (same resonance period), resulting in major building losses and at least 8,000 fatalities.
Earthquake Location and Magnitude
 Earthquakes range broadly in size,
from meter-scale fracturing of rocks to major earthquakes such as the 1965
Rat Island earthquake in the Aleutian arc that involved a 650 kilometer
length of the Earth's crust. We record earthquake activity through seismometers,
which are devices that measure the Earth's sudden movement. The classic
image of a pen that writes a seismogram has been replaced by digital systems,
but the principle remains the same. The greater the earthquake, the
greater the shaking at the Earth's surface. Let's look at a typical
seismogram (Figure). You will notice that there are times of wide swings
of the recorder against a background of small amplitude. Amplitude
is the technical term for the distance between the average background and
the maximum swing of the needle. The pattern falls into two components:
an initial series of swings followed by slowly diminishing activity, then
a second wave of greater amplitude. If the station is sufficiently
close to the earthquake source region, we find that the needle continues
to move even after this second wave of activity. These pulses of
activity record different types of waves that emanate from an earthquake.
Those arriving first are called P-waves, for Primary waves, whereas the
second pulse of waves are predictably called S-waves. Based on these
two waves, the location and magnitude can be determined.
Earthquakes range broadly in size,
from meter-scale fracturing of rocks to major earthquakes such as the 1965
Rat Island earthquake in the Aleutian arc that involved a 650 kilometer
length of the Earth's crust. We record earthquake activity through seismometers,
which are devices that measure the Earth's sudden movement. The classic
image of a pen that writes a seismogram has been replaced by digital systems,
but the principle remains the same. The greater the earthquake, the
greater the shaking at the Earth's surface. Let's look at a typical
seismogram (Figure). You will notice that there are times of wide swings
of the recorder against a background of small amplitude. Amplitude
is the technical term for the distance between the average background and
the maximum swing of the needle. The pattern falls into two components:
an initial series of swings followed by slowly diminishing activity, then
a second wave of greater amplitude. If the station is sufficiently
close to the earthquake source region, we find that the needle continues
to move even after this second wave of activity. These pulses of
activity record different types of waves that emanate from an earthquake.
Those arriving first are called P-waves, for Primary waves, whereas the
second pulse of waves are predictably called S-waves. Based on these
two waves, the location and magnitude can be determined.
Location
P- and S-waves represent different atomic interactions in materials. P-waves briefly compress neighboring atoms, after which they relax and transfer the energy to neighboring atoms. S-waves represent a brief shear motion between atoms, which relaxes and is passed on. The critical consequence for the purpose of earthquake location is that the velocity at which P and S waves travel differs. P-waves move faster than S-waves (hence P and S!). So, if the distance of the earthquake to the recording station increases, the time between the arrival of P- and S-waves will increase. From this P-S travel time difference we can determine the distance of the earthquake to the seismometer. Note that we only get the distance, not the direction of the earthquake focus. The solution is to determine the distance for more than one seismic station, and draw this on a map. Two determinations result in two possible locations (two overlapping circles have two points in common). Three or more determinations can only have one location in common. This location is called the epicenter.
Magnitude
Modern seismographic systems precisely amplify and record ground motion (typically at periods of between 0.1 and 100 seconds) as a function of time. This amplification and recording as a function of time is the source of instrumental amplitude and arrival-time data on near and distant earthquakes. In the 1930's, Charles F. Richter introduced the concept of earthquake magnitude. His original definition held only for California earthquakes occurring within 600 km of a particular type of seismograph (the Woods-Anderson torsion instrument). His basic idea was quite simple: by knowing the distance from a seismograph to an earthquake and observing the maximum signal amplitude recorded on the seismograph, an empirical quantitative ranking of the earthquake's inherent size could be made. Most California earthquakes occur within ~15 km of the surface, so, to a first approximation, corrections for variations in earthquake focal depth were therefore unnecessary.
Richter's original magnitude scale (ML) was then extended to observations of earthquakes of any distance, with focal depths ranging between 0 and 700 km. Because earthquakes generate body waves, which travel into and through the Earth, as well as surface waves, which travel through Earth's uppermost layers, two magnitude scales evolved: the mb and MS scales.
The body-wave magnitude formula is: mb = log10(A/T) + Q(D,h) ,
where A is the amplitude of ground motion (in microns); T is the corresponding period (in seconds); and Q(D,h) is a correction factor that is a function of distance, D (degrees), between epicenter and station and focal depth, h (in kilometers), of the earthquake.
The surface-wave formula is: MS = log10 (A/T) + 1.66 log10 (D) + 3.30 .
There are many variations of these formulas that take into account effects of specific geographic regions, so that the final computed magnitude is reasonably consistent with Richter's original definition of ML.
A rough idea of frequency of occurrence of large earthquakes is given by the following figure:
When initially developed, these magnitude scales were considered to be equivalent; in other words, earthquakes of all sizes were thought to radiate fixed proportions of energy at different periods. But it turns out that larger earthquakes, which have larger rupture surfaces, systematically radiate more long-period energy. Thus, for very large earthquakes, body-wave magnitudes badly underestimate true earthquake size; the maximum body-wave magnitudes are about 6.5 - 6.8. In fact, the surface-wave magnitudes underestimate the size of very large earthquakes; the maximum observed values are about 8.3 - 8.7. Some investigators have suggested that the 100 s mantle Love waves (a type of surface wave) should be used to estimate magnitude of great earthquakes. However, even this approach ignores the fact that damage to structure is often caused by energy at shorter periods. Thus, modern seismologists use another parameters to describe the physical effects of an earthquake: radiated energy.
Energy
The amount of energy radiated by an earthquake is a measure of the potential for damage. Estimates of energy have historically relied on the empirical relationship developed by Beno Gutenberg and Charles Richter:
log10E = 11.8 + 1.5MS
where energy, E, is expressed in ergs. With the worldwide deployment of digitally recording seismographs with broad bandwidth response, computerized methods are now able to make accurate and explicit estimates of energy on a routine basis for all major earthquakes. A magnitude based on energy radiated by an earthquake, Me, can now be defined as:
Me = 2/3 log10E - 9.9 .
Comparing earthquake magnitude and energy released:
| Magnitude Change | Ground Motion
Change (displacement) |
Energy Change |
| 1.0 | 10 times | 32 times |
| .5 | 3.2 times | 5.5 times |
| .3 | 2 times | 3 times |
| .1 | 1.3 times | 1.4 times |
 For example, a magnitude 7.2 earthquake
produces 10 times more ground motion that a magnitude 6.2 earthquake, but
it releases about 32 times more energy. The energy release best indicates
the destructive power of an earthquake.
Earthquake Depth
Earthquakes can occur anywhere between the Earth's surface and about 700 kilometers below the surface. For scientific purposes, this earthquake depth range of 0 - 700 km is divided into three zones: shallow, intermediate, and deep. Shallow earthquakes are between 0 and 70 km deep; intermediate earthquakes, 70 - 300 km deep; and deep earthquakes, 300 - 700 km deep. In general, the term "deep-focus earthquakes" is applied to earthquakes deeper than 70 km. All earthquakes deeper than 70 km are localized within slabs of lithosphere that are sinking into the Earth's mantle.The most obvious indication on a
seismogram that a large earthquake has a deep focus is the small amplitude,
or height, of the recorded surface waves. Although the surface-wave pattern
does generally indicate that an earthquake is either shallow or may have
some depth, the most accurate method of determining the focal depth of
an earthquake is to read a depth phase recorded on the seismogram. The
depth phase is the characteristic phase pP, which is a P wave that is reflected
from the surface of the Earth at a point relatively near the hypocenter.
At distant seismograph stations, the pP follows the P wave by a time interval
that changes slowly with distance but rapidly with depth. This time interval,
pP-P (pP minus P), is used to compute depth-of-focus tables. Using the
time difference of pP-P as read from the seismogram and the distance between
the epicenter and the seismograph station, the depth of the earthquake
can be determined from published travel-time curves or depth tables.
Earthquake Monitoring
Scientists study the past frequency of large earthquakes in order to determine the future likelihood of similar large shocks. For example, if a region has experienced four magnitude 7 or larger earthquakes during 200 years of recorded history, and if these shocks occurred randomly in time, then scientists would assign a 50 percent probability (that is, just as likely to happen as not to happen) to the occurrence of another magnitude 7 or larger quake in the region during the next 50 years.But in many places, the assumption of random occurrence with time may not be true, because when strain is released along one part of the fault system, it may actually increase on another part. Four magnitude 6.8 or larger earthquakes and many magnitude 6 - 6.5 shocks occurred in the San Francisco Bay region during the 75 years between 1836 and 1911. For the next 68 years (until 1979), no earthquakes of magnitude 6 or larger occurred in the region. Beginning with a magnitude 6.0 shock in 1979, the earthquake activity in the region increased dramatically; between 1979 and 1989, there were four magnitude 6 or greater earthquakes, including the magnitude 7.1 Loma Prieta earthquake. This clustering of earthquakes leads scientists to estimate that the probability of a magnitude 6.8 or larger earthquake occurring during the next 30 years in the San Francisco Bay region is about 67 percent (twice as likely as not).
Another way to estimate the likelihood of future earthquakes is to study how fast strain accumulates. When plate movements build the strain in rocks to a critical level, like pulling a rubber band too tight, the rocks will suddenly break and slip to a new position. Scientists measure how much strain accumulates along a fault segment each year, how much time has passed since the last earthquake along the segment, and how much strain was released in the last earthquake. This information is then used to calculate the time required for the accumulating strain to build to the level that results in an earthquake. This simple model is complicated by the fact that such detailed information about faults is rare. In the United States, only the San Andreas fault system has adequate records for using this prediction method.
Both of these methods, and a wide array of monitoring techniques, are being tested along part of the San Andres fault. For the past 150 years, earthquakes of about magnitude 6 have occurred an average of every 22 years on the San Andreas fault near Parkfield, California. The last shock was in 1966. Because of the consistency and similarity of these earthquakes, scientists have started an experiment to "capture" the next Parkfield earthquake. A dense web of monitoring instruments was deployed in the region during the late 1980s. The main goals of the ongoing Parkfield Earthquake Prediction Experiment are to record the geophysical signals before and after the expected earthquake; to issue a short-term prediction; and to develop effective methods of communication between earthquake scientists and community officials responsible for disaster response and mitigation. This project has already made important contributions to both earth science and public policy.
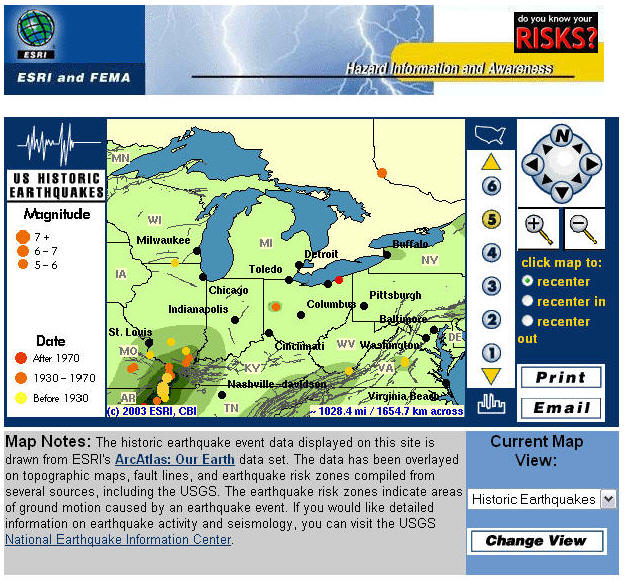
Information on the recent earthquakes (including time, location, magnitude and maps): http://wwwneic.cr.usgs.gov/neis/bulletin/bulletin.html http://gldss7.cr.usgs.gov/neis/general/handouts/general_seismicity.html http://pubs.usgs.gov/gip/earthq1
Volcanoes
Volcanoes generate a wide variety of phenomena that can alter the Earth's
surface and atmosphere and endanger people and property. Small events may
pose hazards only within a few miles of a volcano, while large events can
directly or indirectly endanger people and property tens to hundreds of
miles away. First we'll explore the origin of magma and then we'll look
at some eruptive types and associated hazards.
Go to VolcanoWorld's interactive site to see currently active volcanoes. Some linked sites offer webcams that show real-time images of eruption (or sleeping) volcanoes. You can search NOAA's Volcano database using your favorite criteria.
Magma formation
When going deeper into Earth, the temperature (and pressure) increase. This change is called the geothermal gradient. At first it increases by 20-30C/km, but below 15 km the increase is less. At the crust-mantle boundary (~40 km depth), the temperature is 700-800C, whereas at the core-mantle boundary the temperature is about 4000C (hot enough to melt iron). You will recall that temperature increase can change the state of matter from solid to liquid to gas. But pressure opposes this progression, such that increasing pressure will tend to keep matter in its most dense (=solid) form. The widespread presence of active volcanism and extrusive rocks tell us that there must be molten rock hidden in the Earth. Do not think that there is a sea of lava somewhere below the surface, but in places the condition are just right to make liquids (and gases). How does this happen?
 We'll
illustrate the principle in a schematic diagram that plots the stability
fields of solid and liquid for a representative mantle rock (say, a peridotite,
which is an olivine-rich rock). The solidus, the line that separates solid
from liquid has a positive slope; i.e., larger pressures require larger
temperatures for melting to occur. In order to translate this P-T diagram
to the Earth, you need to know that pressure increases with depth by the
following equation: P = density x gravity x depth. Taking a representative
upper mantle density of 2900 kg*m-3 gives a pressure increase
per km of: 2900 x 9.8 x 1000 = 28 x 106 Pa = 28 MPa (280 bar). Thus at
~40 km depth, the corresponding pressure is > 1 GPa.
We'll
illustrate the principle in a schematic diagram that plots the stability
fields of solid and liquid for a representative mantle rock (say, a peridotite,
which is an olivine-rich rock). The solidus, the line that separates solid
from liquid has a positive slope; i.e., larger pressures require larger
temperatures for melting to occur. In order to translate this P-T diagram
to the Earth, you need to know that pressure increases with depth by the
following equation: P = density x gravity x depth. Taking a representative
upper mantle density of 2900 kg*m-3 gives a pressure increase
per km of: 2900 x 9.8 x 1000 = 28 x 106 Pa = 28 MPa (280 bar). Thus at
~40 km depth, the corresponding pressure is > 1 GPa.
What happens when heating a solid that starts at 100 km depth and 500C? When it reaches the solidus, at ~1300C, the rock will melt. So, melting occurs when we add heat. Perhaps surprisingly, a rock at, say, 500 km depth and 1500C will be able to melt when we reduce the pressure. So, bringing hot rocks closer to the surface can create melts without a corresponding temperature increase. Recall that pressure resists expansion, i.e. melting. Lastly, a dashed line is shown in the P-T diagram, which represent the solidus for peridotite with a few percent water in the rock. The presence of water lowers the melting temperature of rocks, which relates to the nature of weakened atomic bonds in minerals with water. So, introducing H2O can cause melting, while P and T remain unchanged. In summary, there are three ways to create melts: heating, depressurizing and water introduction.
Distribution of the World's Volcanoes. Click here to open an interactive site at the Smithsonian to learn more about regional volcanism and individual volcanoes
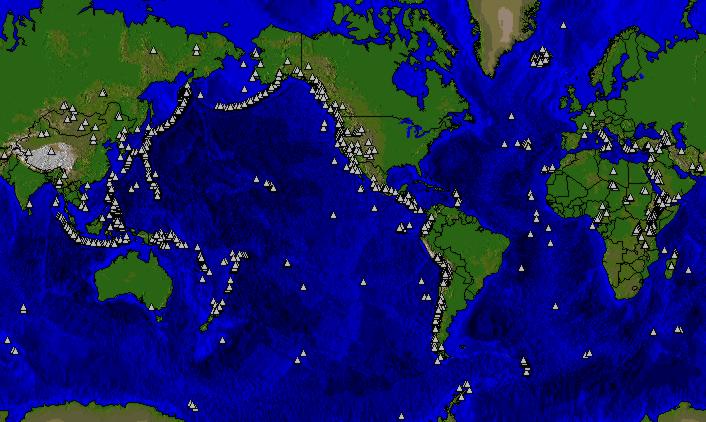
When we look at the location of Earth's
~500 active volcanoes around the world, we find that they occur
in selected regions and that these regions characteristically reflect the
activity of one of the melting mechanisms. Hawaii is an example of heating,
Iceland in the North Atlantic Ocean is an example of depressurizing, and
the South American Andes result from water addition. Later we'll see that
these three mechanisms relate beautifully to the nature of plate margins.
For now we close this section with a look at some volcanic hazards and
a brief mention of monitoring efforts of volcanic activity.
Volcanic Hazards
The section below describes different types of volcanic hazards. It is taken from a USGS brochure and gives you some idea of the terminology used and associated properties. The information is for reference only.Jump to: [Eruption Columns] [Pyroclastic Flows] [Lava Flows] [Debris Flows and Landslides]
Figure 7. Volcanic hazards.
Eruption Columns
An explosive eruption blasts molten and solid rock fragments (tephra) into the air with tremendous force. The largest fragments (bombs) fall back to the ground near the vent, usually within 3 km. The smallest rock fragments (ash) continue rising into the air, forming a huge, billowing eruption column. Volcanic ash is composed of fragments of rock, minerals, and glass that are less than 2 millimeters in diameter.
Eruption columns can be enormous in size and grow rapidly, reaching more than 12 miles above a volcano in less than 30 minutes. Once in the air, the volcanic ash and gas form an eruption cloud. Eruption clouds pose a serious hazard to aviation. During the past 15 years about 80 commercial jets have been damaged by inadvertently flying into ash, and several have nearly crashed. Large eruption clouds can travel hundreds of miles downwind from a volcano, resulting in ash fall over enormous areas. Ash from the May 18, 1980, eruption of Mount St. Helens was deposited over 22,000 square miles of the western United States. With increasing distance downwind from a volcano, the ash particles become smaller and the thickness of the resulting layer decreases. Minor ashfall can be a nuisance to people and damage crops, electronics, and machinery; heavy ashfall can collapse buildings.
Even when a volcano is not erupting, cracks in the ground allow gases to vent into the atmosphere through fumaroles. The most common volcanic gases are water vapor (90%), carbon dioxide, sulfur dioxide, hydrogen sulfide, and hydrogen. Sulfur dioxide gas can react with water droplets in the atmosphere downwind and fall as acid rain, causing corrosion and adversely affecting vegetation. Carbon dioxide is heavier than air and tends to collect in depressions, where on occasion it can accumulate in lethal concentrations and cause people and animals to suffocate. Sometimes, toxic concentrations of fluorine are adsorbed onto ash and ingested by livestock or leached into domestic water supplies.
Large eruptions inject sulfur dioxide gas into the stratosphere, where it combines with water to form an aerosol of sulfuric acid. By reflecting solar radiation, the sulfur aerosols can lower Earth's average surface temperature by a few degrees Fahrenheit. These aerosols also hasten ozone destruction by altering chlorine and nitrogen chemical species in the stratosphere.
Pyroclastic Flows
High-speed avalanches of hot ash, rock fragments, and gas move down the sides of a volcano during explosive eruptions or when the steep edge of a dome breaks apart and collapses. These pyroclastic flows, which can reach 1500 degrees F and move at 100-150 miles per hour, are capable of knocking down and burning everything in their paths. A more energetic and dilute mixture of searing gas and rock fragments is called a pyroclastic surge. Surges move easily up and over ridges; flows tend to follow valleys.
The May 18, 1980 eruption of Mount St. Helens generated a horizontally directed series of explosions that formed a lateral blast. This blast destroyed an area of 230 square miles. Trees 6 feet in diameter were mowed down like blades of grass as far as 15 miles from the volcano. The blast exhibited characteristics of both pyroclastic flows and surges.
Lava Flows
Molten rock (magma) that pours or oozes onto the Earth's surface is called lava. The higher a lava's silica (Si) content, the more viscous (stickier) it becomes. For example, low-silica basalt lava can form fast-moving (15-50 km per hour), narrow lava streams or spread out in broad sheets up to several miles wide. Between 1983 and 1993, basalt lava flows erupted at Kilauea Volcano in Hawaii destroyed nearly 200 houses and severed the coast highway along the volcano's south flank.
In contrast, higher-silica andesite and dacite lava flows tend to be thick, move slowly, and travel short distances from a vent. Dacite and rhyolite lava flows often form mound-shaped features called domes. Between 1980 and 1986, Mount St. Helens built a lava dome about 300 m high and 1500m in diameter.
Debris Flows and Landslides
Lahars, the technical term for debris flows, are mixtures of water, rock, sand, and mud that rush down valleys leading away from a volcano. They can travel over 75 km downstream, commonly reaching speeds between 30 and 60 km per hour. Sometimes they contain so much rock debris (60-90% by weight) that they look like fast-moving rivers of wet concrete. Close to the volcano they have the strength to rip huge boulders, trees, and houses from the ground and carry them down valley. Further downstream they simply entomb everything in mud. Historically, lahars have been among the most deadly volcanic hazards.
Lahars can form in a variety of ways, either during an eruption or when a volcano is quiet. Some examples include the following: (1) rapid release of water from the breakout of a summit crater lake; (2) generation of water by melting snow and ice, especially when a pyroclastic flow erodes a glacier; (3) flooding following intense rainfall; and (4) transformation of a volcanic landslide into a lahar as it travels downstream.
A landslide is a rapid downslope movement of rock, snow, and ice. Landslides range in size from small movements of loose debris on the surface of a volcano to massive failures of the entire summit or flanks of a volcano. Volcanic landslides are not always associated with eruptions; heavy rainfall or a large regional earthquake can trigger a landslide on steep slopes. Volcanoes are susceptible to landslides because they are composed of layers of weak, fragmented, volcanic rocks that tower above the surrounding terrain. Furthermore, some of these rocks have been altered to soft, slippery, clay minerals by hot, acidic ground water inside the volcano. At least five large landslides have swept down the slopes of Mount Rainier during the past 6,000 years. The largest volcanic landslide in historical time occurred at Mount St. Helens on May 18, 1980.
Monitoring
The most common methods to study volcanic activity are measurement of changes in the shape of the volcano, determination of the location and magnitude of earthquakes, and measurement of changes in volcanic-gas composition and magnetic field.Measurement of changes in the
shape of a volcano
Volcanoes gradually swell or "inflate"
in building up to an eruption because of the influx of magma into the volcano's
reservoir or "plumbing system." With the onset of eruption, pressure is
immediately relieved and the volcano rapidly shrinks or "deflates." A wide
variety of instruments, including precise spirit-levels, electronic tiltmeters,
and electronic-laser beam instruments, can measure changes in the slope
or "tilt" of a volcano or in vertical and horizontal distances with a precision
of only a few parts in a million.
Precise determination of the
location and magnitude of earthquakes by a well-designed seismic network
As a volcano inflates by the rise
of magma, the enclosing rocks are deformed to the breaking point to accommodate
magma movement. When the rock ultimately fails to permit continued magma
ascent, earthquakes result. By carefully mapping out the variations with
time in the locations and depths of earthquake foci, scientists in effect
can track the subsurface movement of magma, horizontally and vertically.
Measurement of changes in volcanic-gas
composition and in magnetic field
The rise of magma high into the
volcanic edifice may allow some of the associated gases to escape along
fractures. Thus the composition of the gases (measured at the surface)
differs from that usually measured when the volcano is quiescent and the
magma is too deep to allow gas to escape. Changes in the Earth's magnetic
field have been noted preceding and accompanying some eruptions, and such
changes are believed to reflect temperature effects and/or the content
of magnetic minerals in the magma.
Summary
Earthquakes can be categorized according to their location (focus & epicenter), intensity, magnitude, and energy. Seismic waves are created by the release of energy stored in rocks. The speed at which different types of seismic waves travel can be used to determine the epicenter of an earthquake.Volcanoes erupt as a result of high-pressure gas and magma below the surface of the Earth. The magma forms through heating, depressurizing, and water introduction. Eruptions of volcanoes produce pyroclastic flows, lava flows, debris flows, and landslides.
Although these natural disasters
have been studied extensively and their causes are well-understood, predicting
such events over short time scales remains difficult.
Self Tests
Take the Self-Test for this lecture and try NOAA's Natural Hazards Quiz.
Copyright University of Michigan unless indicated otherwise.